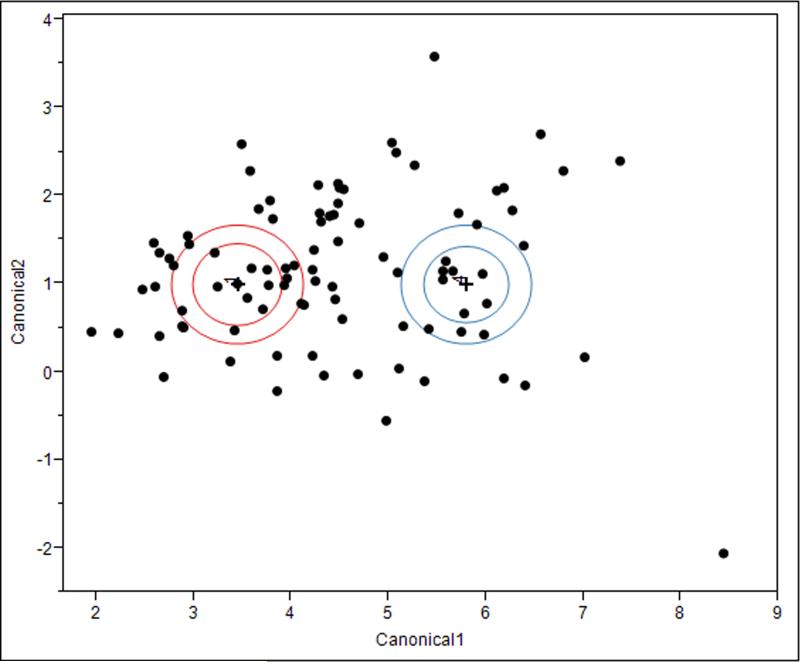
Figure 3.
Linear discriminant analysis canonical plot of TEG maximal amplitude quartiles 1 and 4 discriminated by fibrinogen concentration and platelet contractile force measurements. The multivariate mean for each quartile is a labeled inner circle corresponding to a 95% confidence limit for the mean. Groups that are significantly different tend to have non-intersecting circles. Larger contours show areas that contain roughly 50% of the points for that group. Fibrinogen and PCF can clearly discriminate the lowest from highest MA quartiles in this cohort with only 6.7% misclassified.

