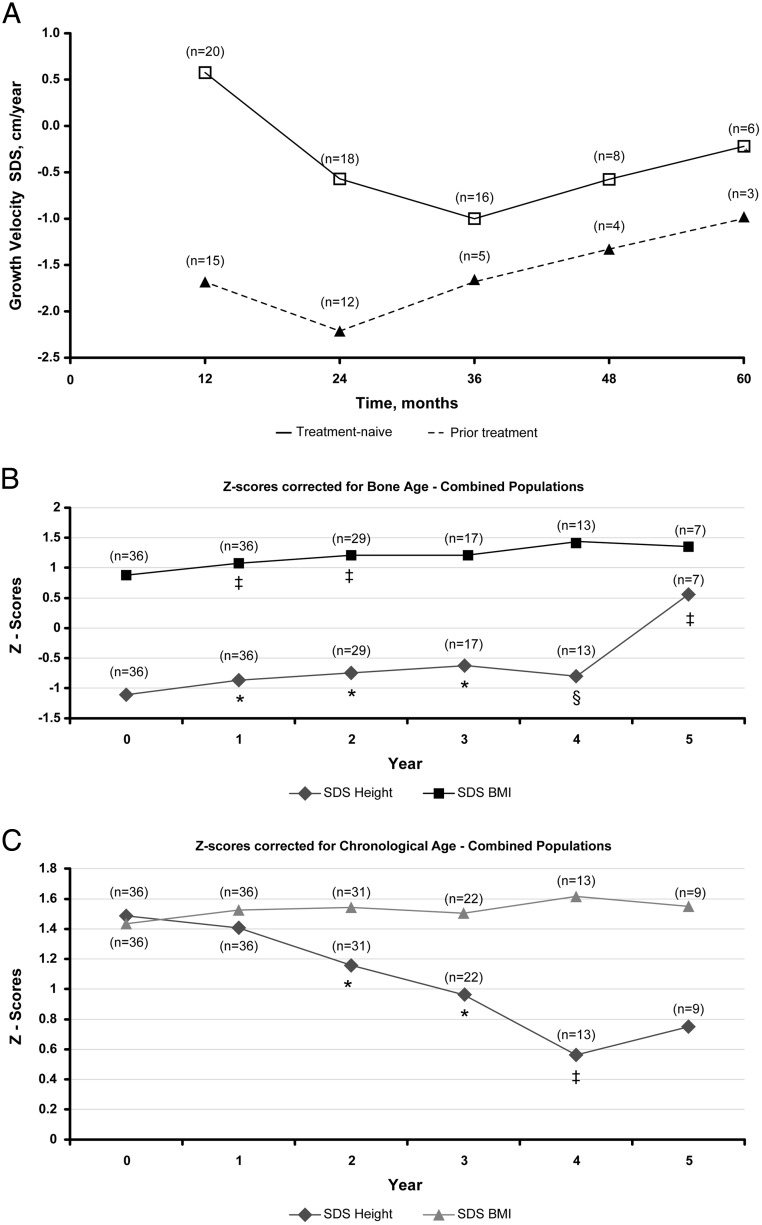
Figure 5.
A, Growth velocity SDSs from baseline up to 5 years. *, P ≤ .0001; ‡, P < .01; §, P < .05 vs baseline. Growth velocity SDSs were based on the Growth Calculator, version 2.01, from Children's Hospital in Boston. B and C, Mean height and BMI SDSs in the combined population adjusted for bone age (B) or chronological age (C). *, P ≤ .01; ‡, P < .02; §, P < .05 vs baseline.

