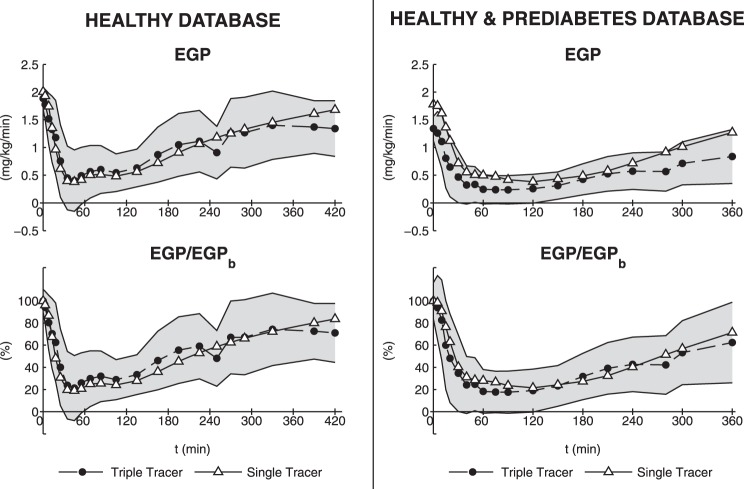
Fig. 5.
OMMPD predictions (solid line and △) vs. triple-tracer estimates (dashed line and ●) with SD variability range (gray region). Left: absolute EGP and EGP normalized to basal EGP (EGPb) in healthy database (n = 20). Right: absolute EGP and EGP normalized to EGPb in healthy and prediabetes database (n = 60).

