
Fig. 3.
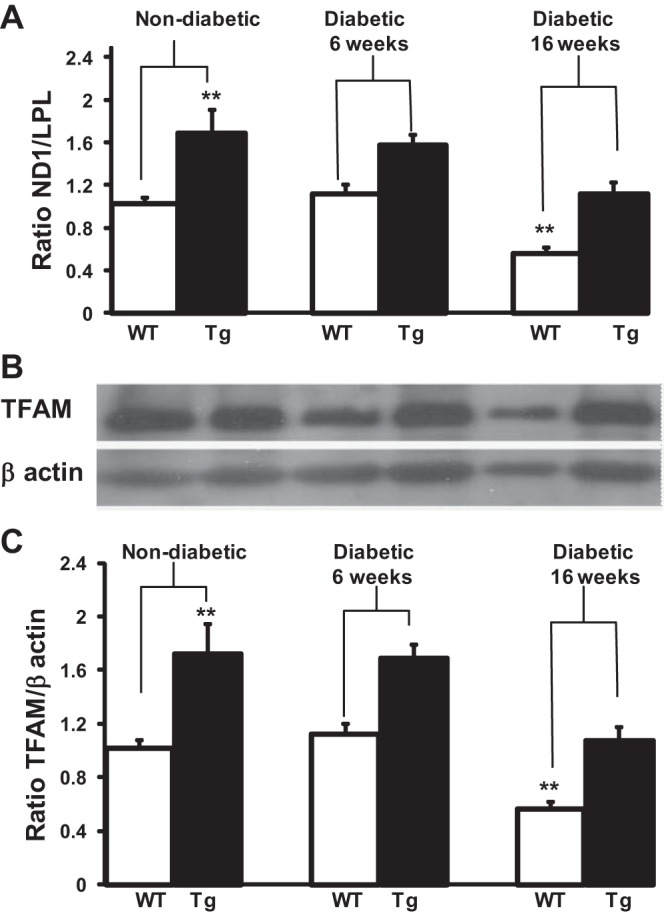
mtDNA content in DRG neurons of WT and TFAM Tg nondiabetic and 16-wk diabetic mice. A: total DNA was isolated from WT and TFAM Tg DRG neurons of nondiabetic control and diabetic mice at 6 and 16 wk after induction of diabetes. Quantitative real-time PCR was done to obtain a relative ratio of NADH dehydrogenase subunit 1 (ND1; a gene coded on the mtDNA) over lipoprotein lipase (LPL; a unigene coded by nDNA). Ratio of ND1 to LPL was determined as an indicator for relative mtDNA content. Data are normalized to nondiabetic WT and expressed as means ± SE. B: total protein was extracted from WT and TFAM Tg DRG neurons of nondiabetic control and diabetic mice at 6 and 16 wk after induction of diabetes. Western blot analysis was with a TFAM antibody that recognizes both hTFAM and mTFAM. Blots were reprobed with β-actin to normalize for loading and transfer. C: ratio of TFAM to β-actin was determined from the intensity of the bands to determine the levels of TFAM. Data are expressed as means ± SE. One-way ANOVA analysis of multiple comparisons with ad hoc Tukey test was used to determine the significance among the groups. **P < 0.01 between WT and Tg mice. Both mtDNA and TFAM protein levels were reduced (P < 0.01) in WT 16-wk diabetic DRG compared with both WT and TFAM Tg diabetic DRG at baseline and 6 wk.