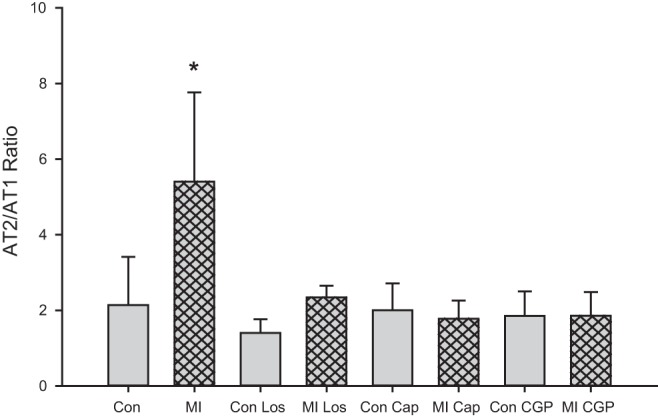
Fig. 9.

Changes in AT2R/AT1R ratios with MI. The ratio of AT2R/AT1R was determined (using values normalized to GAPDH) for each treatment. MI resulted in a significant increase in the relative abundance of AT2R vs. AT2R (*P < 0.01 by ANOVA). All drug treatments, either in control or MI animals, resulted in an AT2R/AT1R ratio equivalent to control ratios.
