Abstract
This study tested the hypothesis that neural coding patterns exist within the autonomic nervous system. We investigated sympathetic axonal recruitment strategies in humans during chemoreflex- and baroreflex-mediated sympathoexcitation using a novel action potential (AP) analysis technique. Muscle sympathetic nerve activity (microneurography) was collected in 11 young individuals (6 females) during baseline and two subsequent protocols: 1) severe chemoreflex stimulation (maximal end-inspiratory apnea following rebreathe), and 2) severe baroreceptor unloading (−80 mmHg lower body negative pressure; LBNP). When compared with each respective baseline, apnea and LBNP increased AP frequency and mean AP content per sympathetic burst (all P < 0.01). When APs were binned according to peak-to-peak amplitude (i.e., into “clusters”), total clusters detected increased during both apnea (Δ7 ± 5; P = 0.0009) and LBNP (Δ11 ± 8; P = 0.0012) compared with baseline. This was concomitant to an increased number of active clusters per burst during apnea (Δ3 ± 1; P < 0.0001) and LBNP (Δ3 ± 3; P = 0.0076). At baseline and during apnea (R2 = 0.98; P < 0.0001) and LBNP (R2 = 0.95; P < 0.0001), a pattern emerged whereby AP cluster latency decreased as cluster size increased. Furthermore, the AP cluster latency profile was shifted downward during apnea (∼53 ms) and upward during LBNP (∼31 ms). The data indicate that variations in synaptic delays and latent subpopulations of larger axons exist as recruitment strategies for sympathetic outflow. The synaptic delay component appears to express reflex specificity, whereas latent subpopulation recruitment demonstrates sensitivity to stress severity.
Keywords: action potential detection, muscle sympathetic nerve activity, sympathetic neural recruitment patterns, baroreflex, chemoreflex
patterns of neural coding form the basis of all neural processes requiring information exchange and processing. Neural coding patterns include variations in firing rate of single neurons (rate coding), the timing of activity among synchronized or pseudosynchronized neurons (temporal coding), and varying thresholds for recruitment of subpopulations (population coding). Although established largely in intracerebral neural processing, these coding patterns exist in the control of peripheral organs as well, such as during the generation of ever-increasing muscular force (13). Conversely, the neural strategies employed by the autonomic nervous system, which regulates homeostatic and life-sustaining outcomes, remain unclear, particularly in humans where access to direct neural recordings is limited. The multiple sites of control through which efferent sympathetic outflow can be modified include the brain stem autonomic nuclei (3), spinal cord, and paraspinal ganglia (14, 21). These junctures introduce opportunities for modifiable synaptic delays and latent neuronal subpopulations.
With the use of microneurographic techniques (12), direct recordings are made from the populations of postganglionic sympathetic neurons innervating the skeletal muscle vasculature (muscle sympathetic nerve activity; MSNA) in humans. The measured bursts of activity reflect periods of efferent action potential synchronization (7). The size of any given burst is determined by the proximity of the recording electrode to the individual neurons within the respective bundle of sympathetic axons (29), as well as the number (22) and size (24) of action potentials. With the use of these features, the question of neural coding in efferent sympathetic nerve activity was advanced by the introduction of single fiber recordings (20), which indicated that a given axon will fire approximately once per burst and perhaps two to three times during states of elevated sympathetic drive (9, 19). To further study the existence of latent neuronal subpopulations and/or modifiable synaptic delays, our laboratory developed a technique that quantifies and classifies the populations of axons comprising each sympathetic burst (23). With the use of this approach, a fundamental pattern was exposed within the sympathetic nervous system, whereby larger neurons with faster conduction velocities are hierarchically recruited as sympathetic bursts become stronger (i.e., larger), an observation made under baseline conditions (24) and during chemoreceptor activation (28). Importantly, Steinback et al. (28) documented recruitment of latent subpopulations of larger neurons during maximal end-inspiratory apnea, which were absent under baseline conditions. However, in a preliminary study, recruitment of latent axons was not observed during moderate baroreceptor unloading using −60 mmHg lower body negative pressure (LBNP; 24). Discrepancy in neuronal recruitment patterns between studies may be due to reflex-specific strategies, varying thresholds for subpopulation recruitment and/or interindividual variations.
To further understand rate and population coding within the efferent sympathetic nervous system, this study tested the hypothesis of reflex-specific sympathetic neural recruitment strategies during periods of high sympathetic stress in the same individuals and whether these recruitment patterns demonstrated test-retest repeatability.
METHODS
Participants.
Eleven normotensive individuals (6 males, 5 females) participated in the current investigation. Participants were aged 25 ± 3 yr (means ± SD) and were 173 ± 8 cm in height and 70 ± 9 kg in weight (body mass index = 24 ± 2 kg/m2). Participants were regular exercisers, nonsmokers, and free of any overt cardiovascular or respiratory disease (as assessed by a standardized health questionnaire). All protocols in the current investigation were submitted to, and approved by, the Health Sciences Research Ethics Board at Western University in Canada. All participants provided written informed consent and were familiarized to all experimental procedures before study participation.
Experimental protocol.
All testing was conducted following at least a 3-h fast and a 12-h abstinence from alcohol, caffeine, and other stimulants. Female participants were tested during the early follicular menstrual cycle phase. Participants voided their bladder immediately before testing commencement to minimize the effect of bladder distention on sympathetic nerve activity (10). Experimentation entailed two protocols as follows.
In the first protocol, the impact of progressive chemoreflex stress was studied in which data were obtained in the supine position during a 5-min period of baseline (spontaneous breathing) and during a maximal end-inspiratory apnea, which was preceded by a rebreathing period designed to maximize the severity of chemoreflex stimulation through progressive hypoxia and hypercapnia (described previously in detail; 30). Briefly, participants were fitted with a mouthpiece (series 9060, Hans Rudolph, Kansas City, MO) attached to a three-way valve allowing them to breathe either room air, or through a Y-connector (VacuMed, Ventura, CA) leading to two 3-liter breathing bags. Before the start of the protocol, participants expired into the breathing bags to fill them with air for the ensuing rebreathing period. After 5-min of baseline collection, the three-way valve was turned to initiate rebreathing. Once end-tidal partial pressure of oxygen (PetO2) reached 70 Torr, participants performed an end-inspiratory apnea of maximal voluntary duration. Upon cessation, participants breathed twice into and out of the bags to allow for the measurement of end-apnea PetO2 and end-tidal partial pressure of CO2 (PetCO2). Blood gases were analyzed using an infrared CO2 sensor and optical oxygen detector fed from a damped microvacuum sampling pump (ML206 Gas Analyzer, ADInstruments, Colorado Springs, CO). Values were calibrated using ambient air pressure values and converted to online measurements of PetO2 and PetCO2.
In the second protocol, the impact of severe baroreceptor unloading was studied. Data were collected in the supine position during a 5-min period of baseline (spontaneous breathing) and during 3 min of −80 mmHg LBNP. One individual exhibited presyncopal symptoms (i.e., systolic blood pressure <90 mmHg) during the −80-mmHg LBNP protocol; however, data used for this participant included the first 170 s of LBNP before the onset of presyncopal symptoms.
Heart rate was measured using a standard three-lead electrocardiogram. Continuous beat-to-beat mean arterial blood pressure was obtained through finger photoplethysmography (Finometer; Finapres Medical Systems, Amsterdam, The Netherlands). Finometer blood pressures were validated and calibrated to manual sphygmomanometer blood pressure measurements taken throughout the protocol. Stroke volume and cardiac output were obtained using the Finometer Modelflow algorithm. Participant sex, age, height, and weight were input manually into the Finometer to optimize estimation of stroke volume and cardiac output. Total peripheral resistance was calculated as mean arterial pressure divided by cardiac output. Data were collected using LabChart6 and PowerLab data acquisition system (ADInstruments).
Sympathetic neural recordings.
Efferent postganglionic sympathetic outflow was measured in the fibular (peroneal) nerve of the right leg by microneurography (12). Specifically, a tungsten microelectrode (35 mm long, 200 μm in diameter, and tapered to a 1- to 5-μm uninsulated tip) was inserted percutaneously into the nerve just posterior to the fibular head. A reference electrode was positioned subcutaneously 1–3 cm from the recording site. A suitable recording site was searched by manually manipulating the microelectrode until a characteristic pulse-synchronous burst pattern was observed. Confirmation of an MSNA site was determined by the absence of skin paresthesia and a signal that increased firing frequency in response to voluntary apnea, but not during arousal to loud noise (8). The MSNA neurogram was measured with a nerve traffic analysis system (662C-3; Bioengineering of University of Iowa, Iowa City, IA). The neural signal was first preamplified with a gain of 1,000 (using preamplifier and isolation amplifier; gain of 100 and 10, respectively) and further amplified with a gain of 75 (using a variable gain amplifier; gain of 0.1–99). The neural activity was then band-pass filtered (bandwidth of 700-2,000 Hz) before being rectified and integrated (using a leaky integrator; 0.1 s time constant) to obtain a mean voltage neurogram. The raw, filtered, and integrated MSNA signals were sampled at a frequency of 10,000 Hz and stored for further offline analysis (PowerLab Software, ADInstruments).
Integrated MSNA analysis.
Integrated bursts of MSNA were included in the analysis if they exhibited pulse-synchrony, had a signal-to-noise ratio of at least 2:1 with respect to the previous period of neuronal silence between bursts and had characteristic rising and falling slopes. Occurrence of integrated sympathetic bursts was confirmed by visually inspecting the corresponding raw and filtered neurograms.
Integrated sympathetic nerve activity was expressed both as burst frequency (the number of bursts per minute) and burst incidence (the number of bursts per 100 heartbeats). Burst amplitudes during baseline and sympathoexcitatory maneuvers were normalized to the largest recorded burst during each relevant baseline and maneuver period, which was given a value of 100. Total MSNA was quantified as the product of mean normalized burst amplitude and burst frequency.
Action potential detection and analysis.
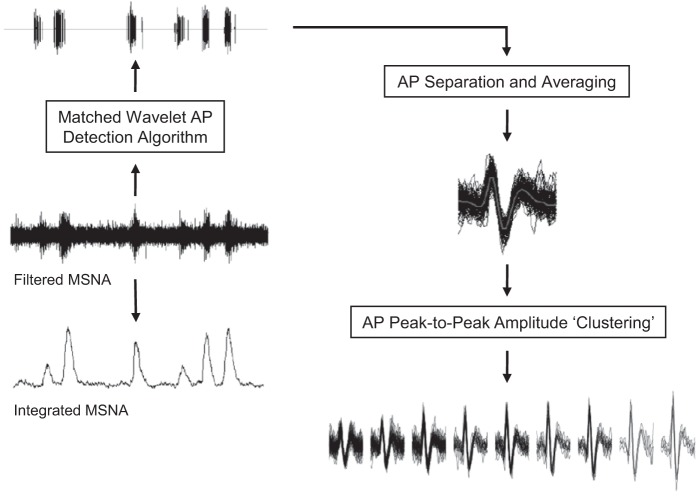
Action potentials were detected and extracted from the filtered raw MSNA signal using the techniques developed in our laboratory and described previously in detail (see Fig. 1 and Ref. 23). Briefly, this approach detects individual action potentials using a continuous wavelet transform (CWT). The CWT uses a “mother wavelet” that was adapted to an actual average action potential waveform constructed from (and with the same morphology as) physiological recordings of efferent postganglionic sympathetic action potentials (23). The CWT was applied to the filtered raw MSNA signal to generate a resemblance index (i.e., wavelet coefficient) between the signal of interest (i.e., an action potential) and the mother wavelet, such that the wavelet coefficient was the greatest in the presence of action potentials and negligible when applied to noise. Wavelet coefficients related to action potentials and noise were separated based on thresholding analysis (16). The exact location of the negative peak for each action potential was then detected by isolating the largest suprathreshold wavelet coefficient. With the use of this location information, the action potential waveforms were obtained from the original filtered raw MSNA signal by setting the estimated location of action potentials in the center of a predefined window (3.2 ms). As such, the amplitude and morphology of each extracted action potential remained unaltered. Extracted action potentials were then ordered based on their peak-to-peak amplitude, and histogram analysis was performed to separate action potentials into “clusters” (i.e., bins or groups of action potentials with similar peak-to-peak amplitudes) defined by Scott's rule (26). Scott's rule proposes the optimal histogram bin width to minimize the integrated mean square error by defining bin width based on the sample size and an estimate of the SD of the data. As such, the number of total clusters varied by participant. To enable comparisons within maneuvers and individuals, bin characteristics across conditions (i.e., baseline vs. apnea; baseline vs. LBNP) were manipulated within each individual to ensure that minimum histogram bin width, maximum bin center, and total number of bins would be identical across conditions. This bin normalization ensured that corresponding clusters at baseline and subsequent sympathoexcitatory maneuvers contained action potentials with similar peak-to-peak amplitudes. As such, new clusters detected during sympathoexcitatory maneuvers represent recruitment of new, larger action potentials not present during baseline.
Fig. 1.
Schematic representation of action potential (AP) detection and classification. MSNA, muscle sympathetic nerve activity.
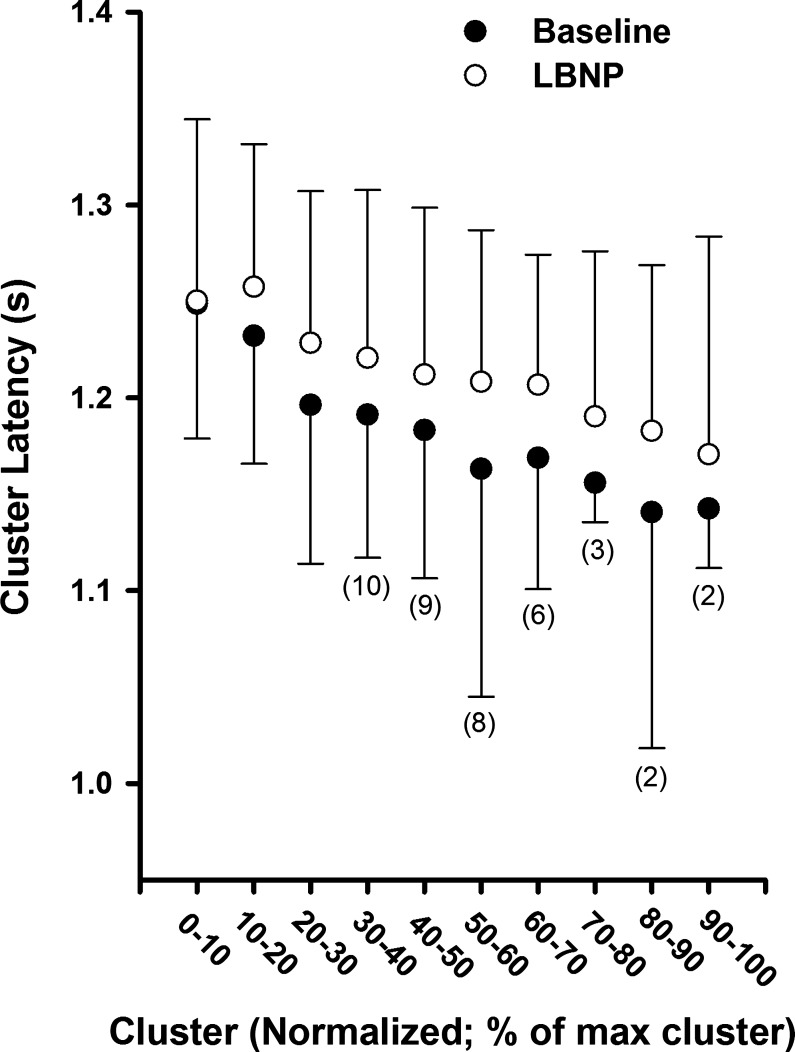
Action potential indices assessed include action potential frequency (the number of action potentials per minute), action potential incidence (the number of action potentials per 100 heartbeats), and the mean action potential content per integrated burst. Additionally, the number of total clusters detected and the number of active clusters per integrated burst were assessed. The conduction latency of each individual action potential was established as the time delay between the R-wave of the electrocardiogram of the preceding cardiac cycle and the negative peak of the action potential waveform. As such, action potential cluster latency was determined as the mean latency of all action potentials contained within each cluster. As the number of total clusters varied by individual, normalization procedures were completed when assessing action potential content and latency as a function of cluster number between individuals (i.e., Figs. 4, 5, 8, and 9). Specifically, each participants' number of total clusters was normalized to 10 total clusters (i.e., bins), each containing a 10% range of the largest detected cluster (i.e., 0–10%, 10–20%, etc.), which was given a value of 100%. For example, cluster 0–10% contained an average of all cluster numbers that were 0–10% of the largest cluster. This procedure was then repeated for the nine remaining clusters.
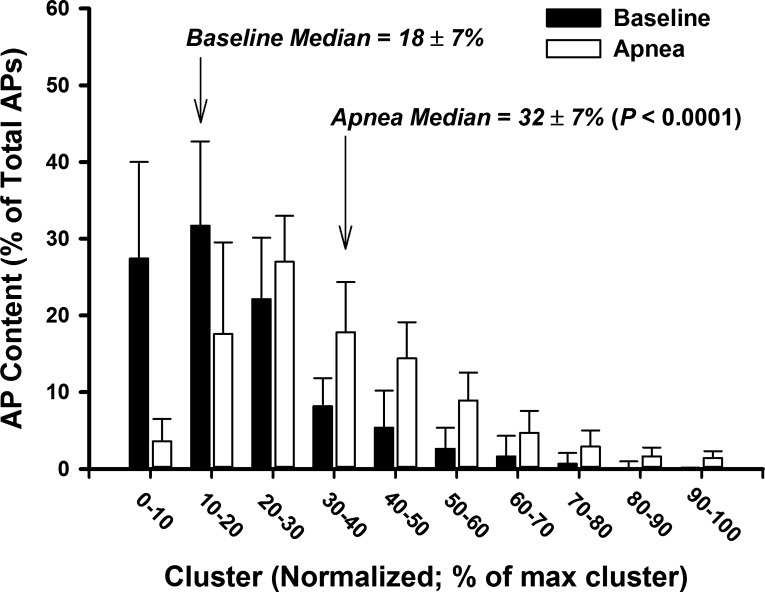
Fig. 4.
Histogram representing AP content as a function of normalized cluster number at baseline and during maximal end-inspiratory apnea.
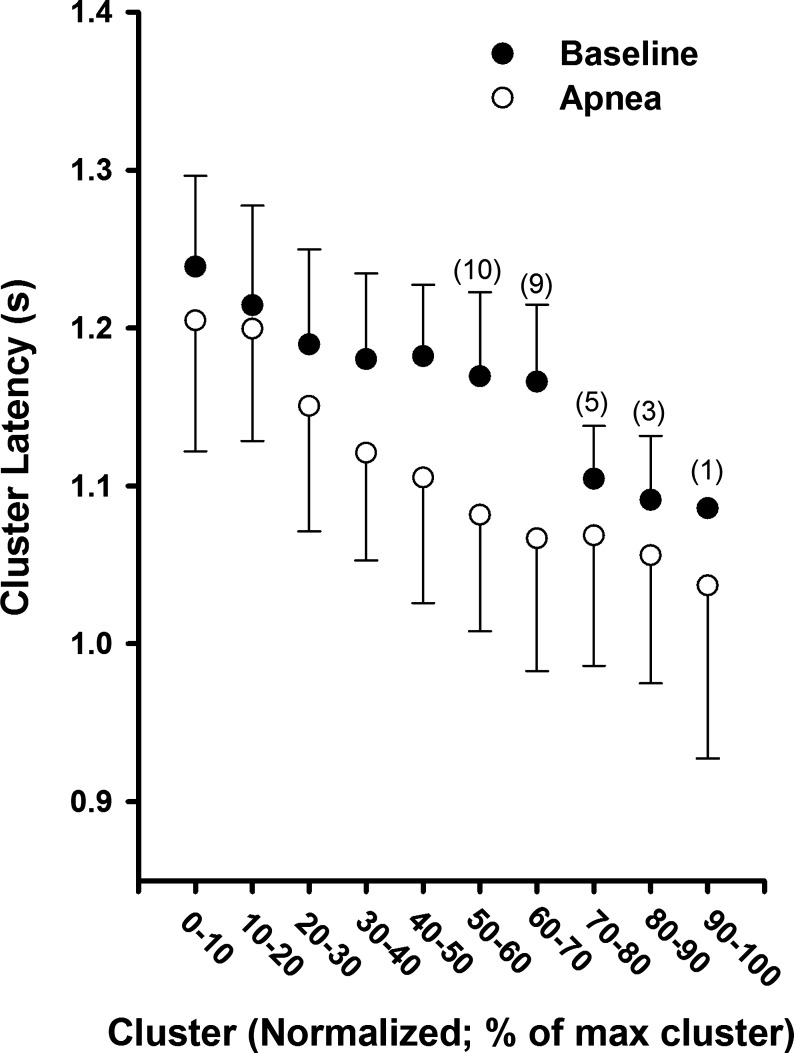
Fig. 5.
Mean action potential cluster latency across participants as a function of normalized cluster number at baseline and during maximal end-inspiratory apnea. Sample size for clusters in which not all 11 subjects are included are indicated in parentheses. Sample sizes <11 at baseline represent subjects in whom these clusters were not present at baseline but were recruited during apnea.
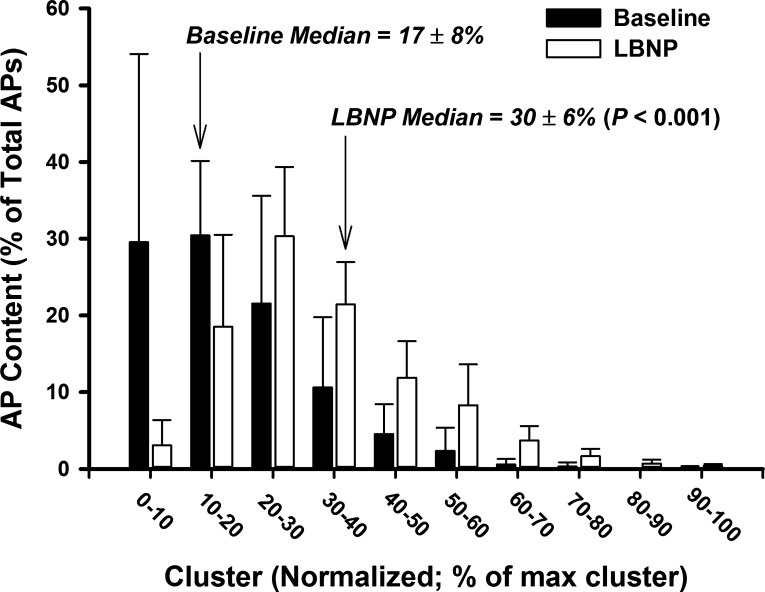
Fig. 8.
Histogram representing AP content as a function of normalized cluster number at baseline and −80 mmHg LBNP.
Fig. 9.
Mean action potential cluster latency across participants as a function of normalized cluster number at baseline and −80 mmHg LBNP. Sample size for clusters in which not all 11 subjects are included are indicated in parentheses. Sample sizes <11 at baseline represent subjects in whom these clusters were not present at baseline but were recruited during LBNP.
Test-retest repeatability of action potential detection.
To assess the test-retest repeatability of this technique to detect and extract action potentials from the filtered raw MSNA signal, male participants (n = 6) were studied a second time ∼1 mo after their initial testing day. All repeat testing was conducted at the same time of day as initial testing. Successful microneurographic recordings were obtained in both test dates in five participants, who are thus included in the test-retest repeatability analysis (chemoreflex protocol; n = 4). Test-retest repeatability of selected action potential variables (action potential frequency and active clusters per burst) was assessed using the Bland-Altman method of differences (1, 4). To determine systematic differences or biases between the two test dates, we assessed measures of fixed bias and proportional bias. Fixed bias occurs when one test produces values that are consistently greater or lesser than those from a second test by a constant amount, whereas proportional bias occurs when one test produces values that are greater or fewer than those from a second test by an amount proportional to the level of the variable assessed (18).
Statistical analysis.
The effect of condition (baseline vs. apnea; baseline vs. LBNP) was assessed by using two-tailed, paired t-tests. Cohen's d values are provided as an estimate of effect size (6). For test-retest repeatability analysis, fixed bias was tested using a one-sample t-test, where the mean difference between test dates was tested against a value of “0”. Proportional bias was determined to exist if the Pearson product-moment correlation coefficient was significantly different from r = 0. Statistical significance was set at P < 0.05 and all data are presented as means ± SD. All statistical analyses were performed using SigmaPlot 12.0 (Systat Software, San Jose, CA).
RESULTS
Baseline versus end-inspiratory apnea.
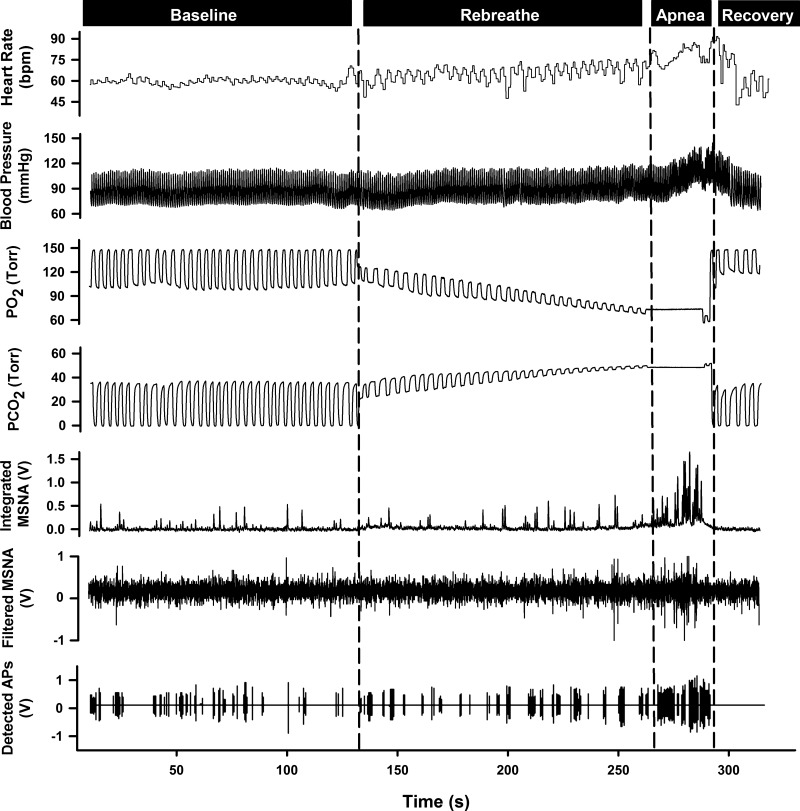
Data were obtained and analyzed for 297 ± 6 s at baseline and during 23 ± 10 s of a maximal end-inspiratory apnea. A representative sample of data collected for one subject at baseline and during chemoreflex conditions is shown in Fig. 2. The rebreathe protocol and subsequent apnea elicited severe chemoreflex stress, as evident by the significant end-apnea decrease in PetO2 and increase in PetCO2 compared with baseline (all P < 0.0001; Table 1). Results from the integrated MSNA analyses at baseline and during apnea are presented in Table 2. Specifically, compared with baseline, burst frequency, burst incidence, mean normalized burst amplitude, and total MSNA were significantly increased during apnea (all P < 0.0001). The elevated sympathetic nerve activity during apnea was concomitant with significant increases in mean arterial blood pressure and total peripheral resistance (both P < 0.05; Table 1).
Fig. 2.
Representative sample of data from one subject collected at baseline, during rebreathe, maximal end-inspiratory apnea, and recovery.
Table 1.
Hemodynamic parameters at baseline and during maximal end-inspiratory apnea
| Baseline | Apnea | |
|---|---|---|
| MAP, mmHg | 86 ± 8 | 97 ± 16† |
| SBP, mmHg | 120 ± 13 | 134 ± 25* |
| DBP, mmHg | 69 ± 8 | 78 ± 15† |
| HR, beats/min | 55 ± 4 | 62 ± 6† |
| SV, ml | 86 ± 12 | 81 ± 11* |
| CO, l/min | 4.7 ± 0.6 | 5.0 ± 0.7 |
| TPR, mmHg·l−1·min−1 | 19 ± 2 | 21 ± 3* |
| PetO2, Torr | 103 ± 3 | 56 ± 3† |
| PetCO2, Torr | 39 ± 3 | 56 ± 4† |
Values are means ± SD. MAP, mean arterial pressure; SBP, systolic blood pressure; DBP, diastolic blood pressure; HR, heart rate; SV, stroke volume; CO, cardiac output; TPR, total peripheral resistance; PetO2, end-tidal partial pressure of O2; PetCO2, end-tidal partial pressure of CO2.
Significantly different from baseline, P ≤ 0.05.
Significantly different from baseline, P ≤ 0.01.
Table 2.
Integrated MSNA and action potential indices at baseline and during maximal end-inspiratory apnea
| Baseline | Apnea | |
|---|---|---|
| Integrated MSNA | ||
| Burst frequency, bursts/min | 15 ± 8 | 48 ± 7* |
| Burst incidence, bursts/100 heartbeats | 28 ± 16 | 77 ± 9* |
| Normalized burst amplitude, AU | 24 ± 6 | 58 ± 9* |
| Total MSNA, AU | 366 ± 220 | 2,745 ± 478* |
| AP indices | ||
| AP frequency, spikes/min | 174 ± 151 | 1,083 ± 487* |
| AP incidence, spikes/100 heartbeats | 325 ± 293 | 1,766 ± 829* |
| APs/burst, spikes/burst | 11 ± 4 | 24 ± 12* |
Values are means ± SD. MSNA, muscle sympathetic nerve activity; AU, arbitrary units; AP, action potential.
Significantly different from baseline, P ≤ 0.01.
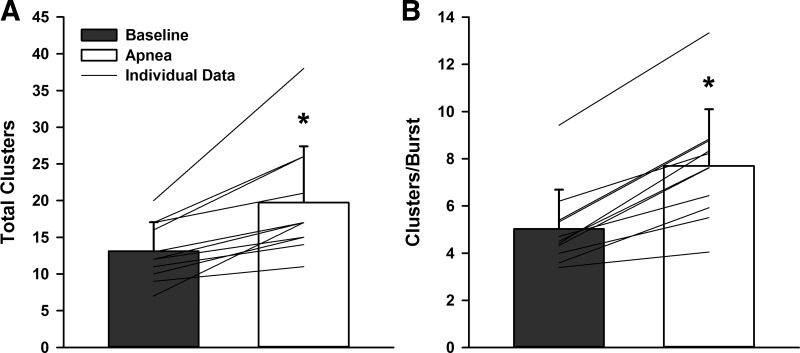
When compared with baseline, both action potential frequency and action potential incidence were elevated during apnea, yielding an increase in the mean action potential content per burst during apnea (all P < 0.01; Table 2). When detected action potentials were binned according to peak-to-peak amplitude, the number of total clusters of action potentials detected (13 ± 4 to 20 ± 8 total clusters; P = 0.0009; d = 1.14; Fig. 3A) increased during apnea. Moreover, the increased number of total clusters was associated with a significant increase in the number of active clusters per sympathetic burst (5 ± 2 to 8 ± 2 clusters/burst; P < 0.0001; d = 1.44; Fig. 3B) during apnea. When histogram analysis was conducted to represent action potential content as a function of normalized cluster number (Fig. 4), a shift in the median occurred during apnea compared with baseline (P < 0.0001), indicating preferential recruitment of larger amplitude action potentials during apnea.
Fig. 3.
Total detected clusters (A) and active clusters/burst (B) at baseline and during maximal end-inspiratory apnea. *Significantly different from baseline, P < 0.001.
At baseline and during apnea, a pattern emerged whereby action potential cluster latency decreased in each subject as cluster number increased (i.e., as peak-to-peak cluster amplitude increased). The mean responses (Fig. 5) were fitted using an exponential function model at baseline (R2 = 0.91; P < 0.001) and during apnea (R2 = 0.98; P < 0.0001). Interestingly, the cluster latency profile was shifted downward for every corresponding cluster number during apnea versus baseline (range −15 to −99 ms; mean = −53 ± 27 ms), indicating that all action potentials with similar peak-to-peak amplitudes were detected ∼53 ms earlier during apnea versus baseline.
Baseline versus −80 mmHg LBNP.
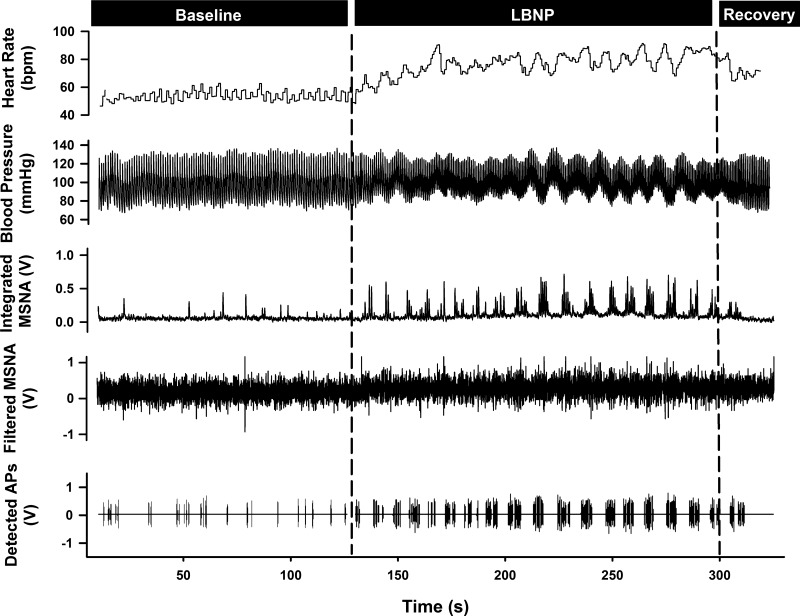
Data were obtained and analyzed for 274 ± 39 s at baseline and for 188 ± 15 s at −80 mmHg LBNP. A representative sample of data collected for one subject at baseline and LBNP is shown in Fig. 6. Hemodynamic parameters at baseline and during LBNP are displayed in Table 3. Results from the integrated MSNA analyses during baseline and LBNP are presented in Table 4. Specifically, compared with baseline, burst frequency, burst incidence, mean normalized burst amplitude, and total MSNA were increased during LBNP (all P < 0.001). The increase in MSNA during LBNP was associated with a pronounced tachycardia and reduction in stroke volume, as well as a significant increase in total peripheral resistance (all P < 0.05; Table 3).
Fig. 6.
Representative sample of data from one subject collected at baseline and during −80 mmHg lower body negative pressure (LBNP) and recovery.
Table 3.
Hemodynamic parameters at baseline and during −80 mmHg lower body negative pressure
| Baseline | LBNP | |
|---|---|---|
| MAP, mmHg | 88 ± 8 | 88 ± 9 |
| SBP, mmHg | 121 ± 14 | 113 ± 14* |
| DBP, mmHg | 71 ± 9 | 75 ± 8* |
| HR, beats/min | 56 ± 6 | 79 ± 14* |
| SV, ml | 89 ± 19 | 59 ± 19† |
| CO, l/min | 4.9 ± 1.0 | 4.4 ± 1.0† |
| TPR, mmHg·l−1·min−1 | 20 ± 4 | 21 ± 4* |
Values are means ± SD. LBNP, lower body negative pressure.
Significantly different from baseline, P ≤ 0.05.
Significantly different from baseline, P ≤ 0.01.
Table 4.
Integrated MSNA and action potential indices at baseline and during −80 mmHg lower body negative pressure
| Baseline | LBNP | |
|---|---|---|
| Integrated MSNA | ||
| Burst frequency, bursts/min | 15 ± 7 | 41 ± 15* |
| Burst incidence, bursts/100 heartbeats | 26 ± 13 | 52 ± 12* |
| Normalized burst amplitude, AU | 31 ± 12 | 52 ± 4* |
| Total MSNA, AU | 472 ± 302 | 2,138 ± 769* |
| AP Indices | ||
| AP frequency, spikes/min | 165 ± 83 | 839 ± 709* |
| AP incidence, spikes/100 heartbeats | 296 ± 140 | 1,027 ± 703* |
| APs/burst, spikes/burst | 11 ± 2 | 19 ± 9* |
Values are means ± SD.
Significantly different from baseline, P ≤ 0.01.
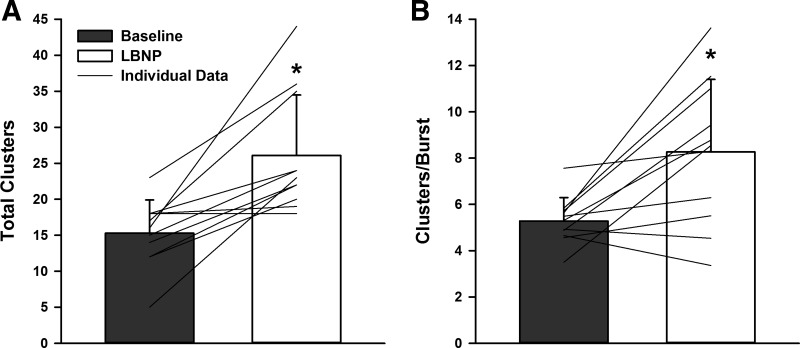
Action potential frequency, action potential incidence, and the mean action potential content per burst were increased during LBNP versus baseline (all P < 0.01; Table 4). When detected action potentials were binned according to their peak-to-peak amplitude, the number of total action potential clusters increased from 15 ± 5 at baseline to 26 ± 8 during LBNP (P = 0.0012, d = 1.66; Fig. 7A), indicating recruitment of approximately 11 additional, larger-amplitude clusters of action potentials during LBNP. This was associated with an increase in the number of active clusters per sympathetic burst during LBNP (5 ± 1 to 8 ± 3 clusters/burst; P = 0.0076, d = 1.44; Fig. 7B). Histogram analysis representing action potential content as a function of normalized cluster number (Fig. 8) revealed a shift in the median value during LBNP compared with the baseline period (P = 0.0011), indicating preferential recruitment of larger amplitude action potentials during LBNP.
Fig. 7.
Total detected clusters (A) and active clusters/burst (B) at baseline and during −80 mmHg LBNP. *Signficantly different from baseline, P < 0.01.
As with the apnea outcomes, action potential cluster latency decreased in each participant as an inverse function of cluster number (i.e., as peak-to-peak amplitude increased) at both baseline and LBNP. Mean responses (Fig. 9) were fitted using an exponential model at baseline (R2 = 0.97; P < 0.0001) and LBNP (R2 = 0.95; P < 0.0001). However, in contrast to apnea, the cluster latency-size profile during LBNP was shifted upward relative to baseline for every corresponding cluster number (range +2 to +45 ms; mean = +31 ± 12 ms), indicating that action potentials with similar peak-to-peak amplitudes were detected ∼31 ms later during LBNP.
Test-retest repeatability of action potential detection.
Results obtained from the Bland-Altman method of differences for action potential detection at baseline and during apnea and LBNP are summarized in Table 5. Specifically, action potential frequency and the number of active clusters per burst were without significant proportional or fixed bias during baseline, apnea, or LBNP in repeated test dates. Furthermore, all hemodynamic, integrated MSNA, and action potential indices assessed were without significant day-to-day variation (all P > 0.05).
Table 5.
Proportional and fixed bias outcomes for action potential detection determined from the Bland-Altman method of differences during baseline, maximal end-inspiratory apnea, and −80 mmHg lower body negative pressure protocols
| Variable | r | PPB | Proportional Bias | Mean Difference ± SE | 95% CI for Mean Difference | PFB | Fixed Bias |
|---|---|---|---|---|---|---|---|
| Baseline | |||||||
| AP frequency | 0.18 | 0.78 | No | 7.0 ± 176.6 | −555.0, 569.0 | 0.97 | No |
| Clusters/burst | 0.04 | 0.95 | No | −0.8 ± 1.8 | −6.4, 4.8 | 0.68 | No |
| Apnea | |||||||
| AP frequency | 0.37 | 0.63 | No | −3.0 ± 309.2 | −1333.6, 1327.6 | 0.99 | No |
| Clusters/burst | 0.02 | 0.98 | No | 0.8 ± 2.6 | −11.8, 10.3 | 0.79 | No |
| LBNP | |||||||
| AP frequency | 0.02 | 0.98 | No | −102.2 ± 179.6 | −673.7, 469.3 | 0.60 | No |
| Clusters/burst | −0.65 | 0.23 | No | −1.6 ± 0.8 | −4.0, 0.9 | 0.16 | No |
N = 5 males; r, Pearson product-moment correlation coefficient for the Bland-Altman method of differences plots; PPB, P value for the Pearson product-moment correlation coefficient for the determination of proportional bias; SE, standard error; CI, confidence interval; PFB, P value for the one sample t-test on the mean differences versus 0 for the determination of fixed bias.
DISCUSSION
The results of the current investigation reveal two novel findings that advance our understanding of the neural coding patterns employed within the sympathetic nervous system. First, we demonstrate the ability to recruit subpopulations of previously silent (i.e., not present at baseline), larger amplitude, and faster conducting sympathetic axons during periods of severe chemoreflex- and baroreflex-mediated sympathoexcitation. We interpret this to be reflective of a reflex-independent sympathetic neural recruitment strategy involving a latent subpopulation of recruitable neurons that are reserved for periods of severe stress. Second, our results demonstrate the potential for reflex-specific changes in neural activation latency during periods of severe sympathetic stress. Specifically, the action potential cluster latency profile was shifted downward during severe chemoreflex stress and upward during severe baroreceptor unloading. Of note, the deflections in the cluster latency response curve were observed equally across all clusters, suggesting that this recruitment strategy was applied to all action potentials and does not reflect slower axonal conduction. Rather, this finding suggests variable synaptic delays as a second strategy to modify postganglionic sympathetic nerve activity. The combined data, observed in the same individuals, supports the idea that both synaptic delay variations and high-threshold subpopulations exist as recruitment strategies for postganglionic efferent sympathetic outflow.
To date, available information on neural recruitment strategies within the sympathetic nervous system has been largely inferred from the integrated neurogram. For example, an early observation that larger integrated bursts exhibit shorter reflex latency led Wallin and colleagues to hypothesize that reductions in central synaptic delays or variations in central pathways may occur and/or that there may exist populations of latent sympathetic neurons with faster conduction velocities (31). More specific positioning of higher impedance electrodes enabled Macefield and colleagues (20) to isolate action potential discharge patterns of single sympathetic axons within human peripheral nerves. This approach revealed that, when active, individual neurons generally fire only once per integrated burst (20), with the probability of multiple within-burst firing increasing during periods of high sympathetic drive (9, 19). Results from these studies led to the idea that increased firing of already active neurons was an important mechanism by which burst strength is elevated during periods of sympathetic stress (19).
Results from the current investigation, which studied action potential recruitment from the multiunit signal in both chemoreflex and baroreflex scenarios in the same individuals, validate and extend these previous observations and provide further insight into sympathetic neuronal recruitment strategies. First, evidence was provided that subpopulations of previously dormant, larger amplitude, and faster conducting sympathetic neurons are recruited during periods of high stress. Importantly, the present data suggest that this appears to be a reflex-independent strategy used within the sympathetic nervous system. These observations support the earlier report that, in addition to higher firing rates of axons already recruited during baseline, severe chemoreflex stress elicits activation of latent, higher threshold, and faster conducting (therefore, larger diameter) axons (28). This discharge pattern was not observed during preliminary results using modest levels of simulated orthostatic stress (i.e., −60 mmHg LBNP), whereby higher frequency firing of action potential clusters already recruited at baseline was the primary determinant of elevated efferent activity, with about 30% of participants demonstrating recruitment of new, larger action potentials (24). Whereas orthostatic tolerance or reserve varies across individuals, it remains likely that the threshold for recruitment of this subpopulation will also vary across individuals and with the level of stress. Our current data indicate that more severe baroreceptor unloading (−80 mmHg LBNP) can elicit recruitment of these latent axons. As such, it appears that during moderate levels of stress, sympathetic activity is elevated through the multiple firing of already active neurons as previously hypothesized (19), whereas severe stress stimulates the recruitment of latent subpopulations of larger axons to achieve the high levels of sympathetic activity necessary. We therefore suggest that there may exist a type of sympathetic reserve, whereby latent subpopulations of larger diameter, faster conducting sympathetic neurons are reserved for severe sympathetic stress.
As previously established (24, 28), and in support of observations from integrated MSNA analyses (31), action potential cluster latency was inversely related to action potential cluster amplitude, whereby larger amplitude neurons exhibited shorter reflex latencies. This pattern was observed both at baseline and during subsequent chemoreflex- and baroreflex-induced sympathoexcitation. Interestingly, during severe chemoreflex stimulation, there was an acute downward shift in the latency-size profile of all corresponding action potential clusters (∼53 ms; see Fig. 5), such that the latency of all action potentials with similar peak-to-peak amplitudes was reduced during severe chemoreflex activation. This systemic downward shift in the cluster latency profile was also demonstrated during the Valsalva maneuver (25), and is consistent with observed changes in mean reflex burst latency seen during several sympathoexcitatory maneuvers (11). The common pattern of this downward shift in latency during both end-inspiratory apnea and Valsalva maneuver suggests a common mechanism may be operating. Specifically, each maneuver elevates intrathoracic pressure, thereby reducing venous return. Each also expresses a particular perceptual stress related to individual volitional tolerance for the maneuver. While these two observations are from different studies, they suggest a cardiac stimulus may have contributed to the apneic outcomes of the current study. Alternatively, variations in action potential latency during chemoreflex stress may be due to direct glutaminergic activation of the rostral ventrolateral medulla from the nucleus tractus solitarius (17) and/or faster conduction velocities within spinal descending pathways specific to chemoreflex stimulation (15).
Conversely, we demonstrate that during −80 mmHg LBNP, the latency-size profile of all corresponding action potential clusters was shifted upward (∼31 ms; see Fig. 9), indicating that similarly sized postganglionic neurons were recruited with a slightly slower latency during severe baroreceptor unloading, a pattern consistent with that seen previously in a preliminary manner during −60 mmHg LBNP (24). These data indicate that the sympathetic nervous system displays a unique ability to modify acutely the reflex latency of all action potentials during severe orthostatic stress. In as much as the conduction velocity of given axon is relatively fixed, these modifications in latency indicate malleability in the synaptic delays between the brain stem and the recording electrode. One limitation of the multiunit recording approach is the inability to ensure that action potentials of the same size are the same neurons with varying latencies during severe sympathoexcitation. However, given the anatomical bundled distribution of axons in peripheral nerves (29), it is unlikely that the recordings reflect completely different populations of neurons. Regardless, all that can be concluded is that action potentials with similar peak-to-peak amplitudes exhibit altered reflex latencies during chemoreflex- and baroreflex-mediated sympathetic stress.
A potential limitation of the present study is that larger amplitude action potentials observed during periods of severe sympathetic stress could theoretically be the result of summation of two smaller-sized neurons firing concurrently, thereby eliciting an artificially large action potential (2, 27). However, the likelihood for action potential summation is very low (∼0.3%; 23). Furthermore, such occurrences can be detected if the resulting action potential is large and does not fit the latency-size pattern (5) so that it is automatically removed from the analysis. Furthermore, the mean signal-to-noise ratio of 4.15 ± 0.5 in the current data sets are expected to produce a correct detection rate of >90% and false detection rate of <3% (23). Another consideration is that larger amplitude action potentials could be the result of firing of neurons in close proximity to the recording electrode tip. However, the consistent pattern that these larger action potentials reflect shorter latencies argues against that possibility. Finally, results from our test-retest repeatability analysis, although completed in a small sample of men (n = 5), suggest that indices of action potential detection are reproducible across test dates. If larger amplitude action potentials were the result of summation or proximity to the recording electrode, one would expect action potential indices to differ in repeated test dates, when the physical relationship between the microelectrode placement and sympathetic axons is likely to differ.
Perspectives and Significance
The current data indicate the existence of neural coding patterns within the autonomic nervous system and enhances our understanding of how the sympathetic nervous system is activated during reflex-mediated stress. Specifically, there appears to be a fixed reflex-independent recruitment strategy, whereby the large increases in sympathetic outflow during severe chemoreflex and baroreflex stress are the result of recruitment of latent subpopulations of larger, faster conducting sympathetic neurons. In addition, it appears as though the sympathetic nervous system is able to acutely modify synaptic delays or central processing times and/or pathways, such that reflex latency of all action potentials are altered during severe sympathetic stress. Taken together, the data provide a new perspective on sympathetic stress responses. This new understanding opens opportunity to study how such axonal recruitment strategies may affect neurotransmitter discharge and overall vascular responses, as well as the effect of age and disease on the patterning of efferent sympathetic outflow.
GRANTS
This work was supported through funding from the Natural Sciences and Engineering Research Council of Canada (to J. K. Shoemaker; 217916-2013), the Ontario Graduate Scholarship Program (to C. W. Usselman), and Canadian Institutes of Health Research Doctoral Research Awards (to M. B. Badrov and C. W. Usselman).
DISCLOSURES
No conflicts of interest, financial or otherwise, are declared by the author(s).
AUTHOR CONTRIBUTIONS
Author contributions: M.B.B. analyzed data; M.B.B., C.W.U., and J.K.S. interpreted results of experiments; M.B.B. prepared figures; M.B.B. drafted manuscript; M.B.B., C.W.U., and J.K.S. edited and revised manuscript; M.B.B., C.W.U., and J.K.S. approved final version of manuscript; C.W.U. and J.K.S. conception and design of research; C.W.U. and J.K.S. performed experiments.
REFERENCES
- 1.Altman DG, Bland JM. Measurement in medicine: the analysis of method comparison studies. Statistician 32: 307–317, 1983. [Google Scholar]
- 2.Andresen MC, Yang M. Interaction among unitary spike trains: implications for whole nerve measurements. Am J Physiol Regul Integr Comp Physiol 256: R997–R1004, 1989. [DOI] [PubMed] [Google Scholar]
- 3.Barman SM, Gebber GL. “Rapid” rhythmic discharges of sympathetic nerves: sources, mechanisms of generation, and physiological relevance. J Biol Rhythms 15: 365–379, 2000. [DOI] [PubMed] [Google Scholar]
- 4.Bland JM, Altman DG. Statistical methods for assessing agreement between two methods of clinical measurement. Lancet 1: 307–310, 1986. [PubMed] [Google Scholar]
- 5.Clamman HP, Henneman E. Electrical measurement of axon diameter and its use in relating motoneuron size to critical firing level. J Neurophysiol 39: 844–851, 1976. [DOI] [PubMed] [Google Scholar]
- 6.Cohen J. Statistical Power Analysis For The Behavioural Sciences (2nd ed). Hillsdale, NJ: Erlbaum, 1988. [Google Scholar]
- 7.Delius W, Hagbarth KE, Hongell A, Wallin BG. General characteristics of sympathetic activity in human muscle nerves. Acta Physiol Scand 84: 65–81, 1972. [DOI] [PubMed] [Google Scholar]
- 8.Delius W, Hagbarth KE, Hongell A, Wallin BG. Manoeuvres affecting sympathetic outflow in human muscle nerves. Acta Physiol Scand 84: 82–94, 1972. [DOI] [PubMed] [Google Scholar]
- 9.Elam M, McKenzie D, Macefield VG. Mechanisms of sympathoexcitation: single-unit analysis of muscle vasoconstrictor neurons in awake OSAS subjects. J Appl Physiol 93: 297–303, 2002. [DOI] [PubMed] [Google Scholar]
- 10.Fagius J, Karhuvaara S. Sympathetic activity and blood pressure increases with bladder distention in humans. Hypertension 14: 511–517, 1989. [DOI] [PubMed] [Google Scholar]
- 11.Fagius J, Sundlöf G, Wallin BG. Variation of sympathetic reflex latency in man. J Auton Nerv Syst 21: 157–165, 1987. [DOI] [PubMed] [Google Scholar]
- 12.Hagbarth KE, Vallbo AB. Pulse and respiratory grouping of sympathetic impulses in human muscle nerves. Acta Physiol Scand 74: 96–108, 1968. [DOI] [PubMed] [Google Scholar]
- 13.Henneman E, Somjen G, Carpenter DO. Excitability and inhibitibility of motoneurons of different sizes. J Neurophysiol 28: 599–620, 1965. [DOI] [PubMed] [Google Scholar]
- 14.Janig W, McLachlan EM. Characteristics of function-specific pathways in the sympathetic nervous system. Trends Neurosci 15: 475–481, 1992. [DOI] [PubMed] [Google Scholar]
- 15.Janig W, Szulczyk P. Conduction velocity in spinal descending pathways of baro- and chemoreceptor reflex. J Auton Nerv Syst 1: 149–160, 1979. [DOI] [PubMed] [Google Scholar]
- 16.Johnstone IM, Silverman BW. Wavelet threshold estimators for data with correlated noise. J R Statist Soc 59: 319–351, 1997. [Google Scholar]
- 17.Koshiya N, Huangfu D, Guyenet PG. Ventrolateral medulla and sympathetic chemoreflex in the rat. Brain Res 609: 174–184, 1993. [DOI] [PubMed] [Google Scholar]
- 18.Ludbrook J. Comparing methods of measurement. Clin Exp Pharmacol Physiol 24: 193–203, 1997. [DOI] [PubMed] [Google Scholar]
- 19.Macefield VG, Wallin BG. Firing properties of single vasoconstrictor neurones in human subjects with high levels of muscle sympathetic activity. J Physiol 516: 293–301, 1999. [DOI] [PMC free article] [PubMed] [Google Scholar]
- 20.Macefield VG, Wallin BG, Vallbo AB. The discharge behaviour of single vasoconstrictor motoneurones in human muscle nerves. J Physiol 481: 799–809, 1994. [DOI] [PMC free article] [PubMed] [Google Scholar]
- 21.McAllen RM, Trevaks D. Are pre-ganglionic neurones recruited in a set order? Acta Physiol Scand 177: 219–225, 2003. [DOI] [PubMed] [Google Scholar]
- 22.Ninomiya I, Malpas SC, Matsukawa K, Shindo T, Akiyama T. The amplitude of synchronized cardiac sympathetic nerve activity reflects the number of activated pre- and postganglionic fibers in anesthetized cats. J Auton Nerv Syst 45: 139–147, 1993. [DOI] [PubMed] [Google Scholar]
- 23.Salmanpour A, Brown LJ, Shoemaker JK. Spike detection in human muscle sympathetic nerve activity using a matched wavelet approach. J Neurosci Methods 193: 343–355, 2010. [DOI] [PubMed] [Google Scholar]
- 24.Salmanpour A, Brown LJ, Steinback CD, Usselman CW, Goswami R, Shoemaker JK. Relationship between size and latency of action potentials in human muscle sympathetic nerve activity. J Neurophysiol 105: 2830–2842, 2011. [DOI] [PubMed] [Google Scholar]
- 25.Salmanpour A, Frances MF, Goswami R, Shoemaker JK. Sympathetic neural recruitment patterns during the Valsalva maneuver. Conf Proc IEEE Eng Med Biol Soc 2011: 6951–6954, 2011. [DOI] [PubMed] [Google Scholar]
- 26.Scott DW. On optimal and data-based histograms. Biometrika 66: 605–610, 1979. [Google Scholar]
- 27.Spickler JW, Kezdi P. Probabilities of spike summations in baroreceptor electroneurograms. J Appl Physiol 27: 919–922, 1969. [DOI] [PubMed] [Google Scholar]
- 28.Steinback CD, Salmanpour A, Breskovic T, Dujic Z, Shoemaker JK. Sympathetic neural activation: an ordered affair. J Physiol 588: 4825–4836, 2010. [DOI] [PMC free article] [PubMed] [Google Scholar]
- 29.Tompkins RP, Melling CW, Wilson TD, Bates BD, Shoemaker JK. Arrangement of sympathetic fibers within the human common peroneal nerve: implications for microneurography. J Appl Physiol 115: 1553–1561, 2013. [DOI] [PMC free article] [PubMed] [Google Scholar]
- 30.Usselman CW, Gimon TI, Nielson CA, Luchyshyn TA, Coverdale NS, Van Uum SHM, Shoemaker JK. Menstrual cycle and sex effects on sympathetic responses to acute chemoreflex stress. Am J Physiol Heart Circ Physiol (December 19, 2014). doi: 10.1152/ajpheart.00345.2014. [DOI] [PMC free article] [PubMed] [Google Scholar]
- 31.Wallin BG, Burke D, Gandevia S. Coupling between variations in strength and baroreflex latency of sympathetic discharges in human muscle nerves. J Physiol 474: 331–338, 1994. [DOI] [PMC free article] [PubMed] [Google Scholar]


