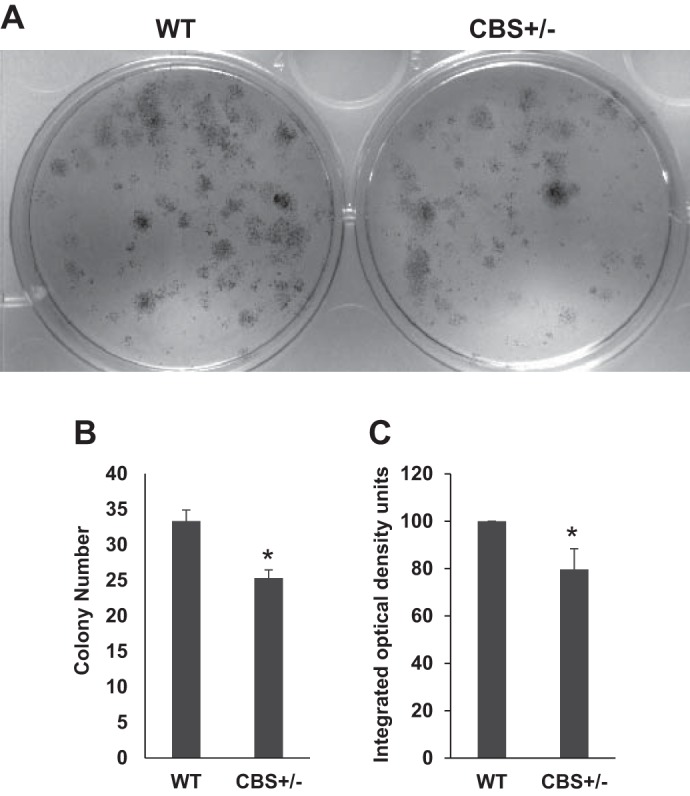
Fig. 4.

Compromised colony forming ability of the satellite cells from CBS−/+ mouse muscles. A: representative culture wells show crystal violet staining of colonies formed after 5 days of culture of equal number of purified satellite cells from WT and CBS−/+ mouse muscles. B: bar graph depicts average number of colonies from each well. C: the bar graph displays average crystal violet staining density across the well from the three different experiments as measured with ImageJ software. *P < 0.05 vs. WT.
