Fig. 5.
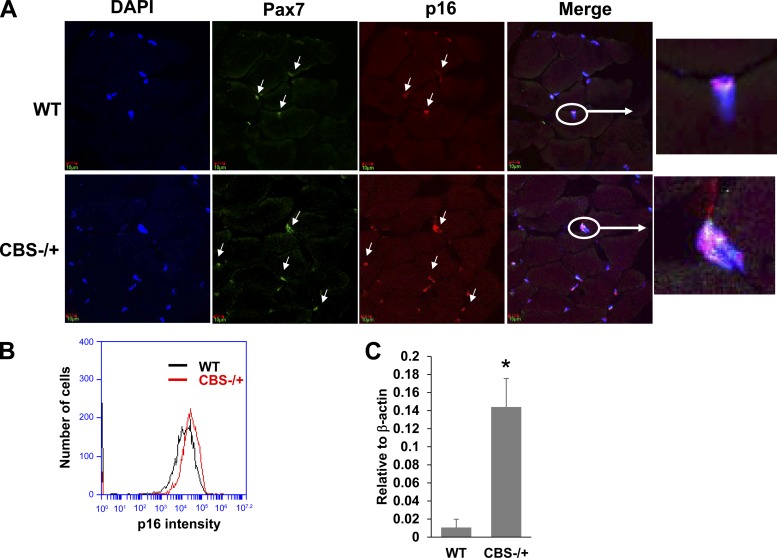
CBS−/+ mouse satellite cells expressed elevated cell cycle inhibitors. A: representative confocal images (60×) showing the staining for nuclei (DAPI-blue); Pax7 (green); and p16 (red) and merged image showing the colocalization of p16 and Pax7 in the nuclei. Inset depicts the representative nucleus with all the three colors. B: flow cytogram showing the p16 intensity levels in the Pax7-expressing satellite cells from WT and CBS−/+ mouse muscles. C: bar graph displaying the relative p21 mRNA levels as assayed by the Q-PCR. Level of beta-actin was used to normalize the mRNA levels in the samples. *P < 0.05 vs. WT.

