
FIGURE 6.
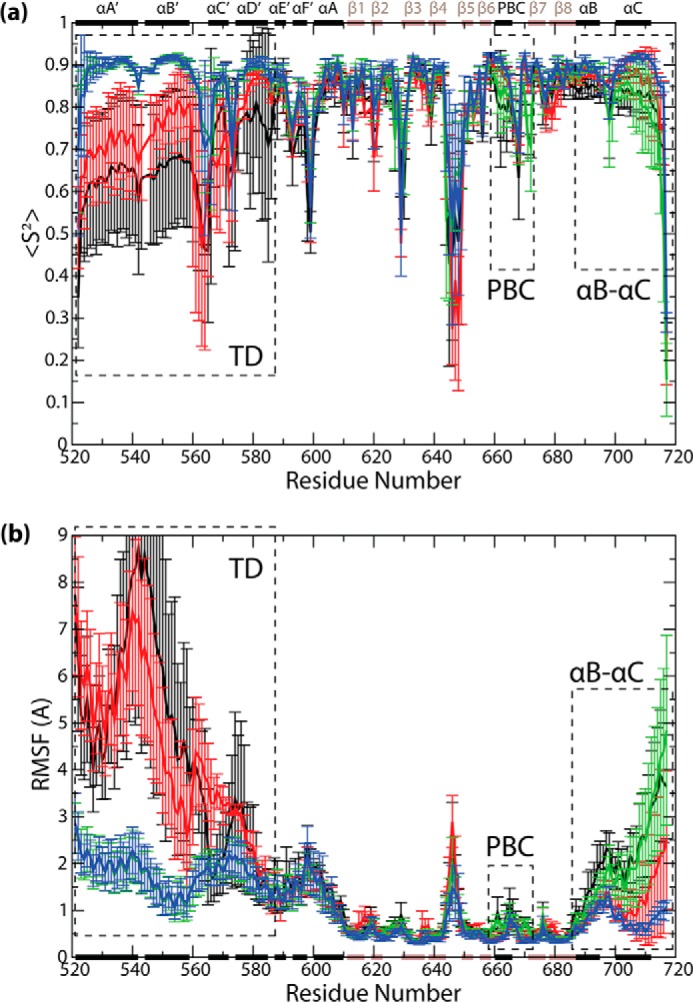
a, backbone N-H order parameters (S2), and b, RMSFs versus residue number plots, computed with structure overlay at the β-core, and averaged across all protomers and replicates for the respective states. The secondary structure elements are indicated along the horizontal dimensions of both graphs (black bars, α-helices; brown bars, β-strands), and structural regions exhibiting notable differences among states are indicated (dotted rectangles).