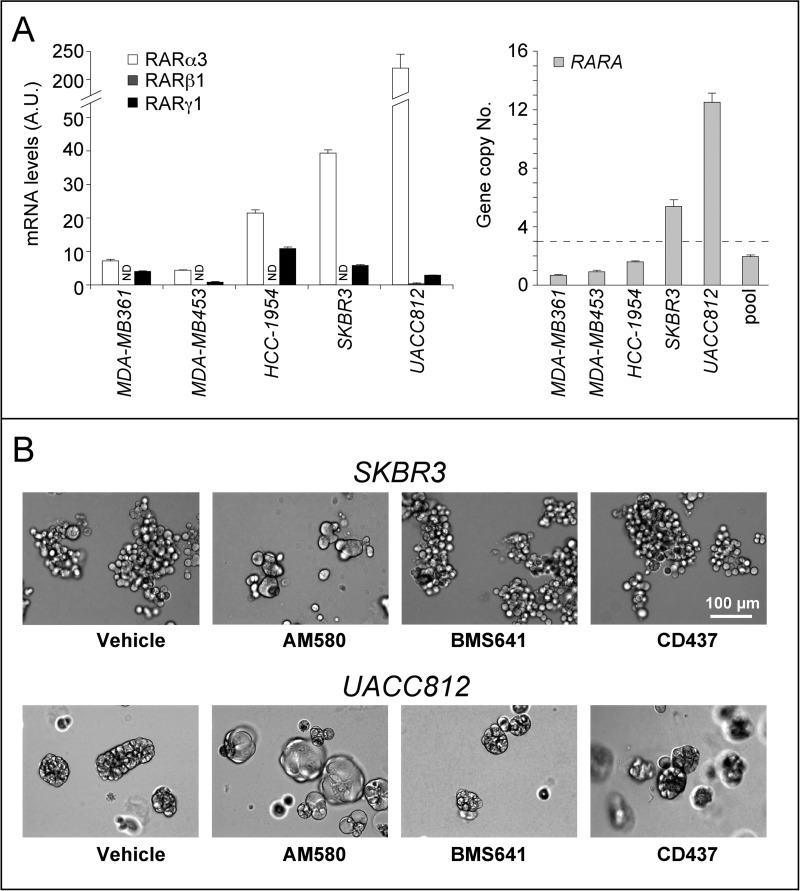
FIGURE 5.
RARα, RARβ, and RARγ expression and RARA gene copy number in breast cancer cells; role of RAR isoforms in ATRA-modulated cell plasticity. A, right, the histogram shows the copy number of the RARA gene in a panel of breast cancer cell lines, as determined by qRT-PCR. The threshold value for the amplification of the gene is shown by the horizontal dashed line. Pool, reference human genomic DNA. Each value is the mean ± S.D. of three independent determinations. Left, the bar graph shows the levels of the major RARα, RARβ, and RARγ transcripts expressed in the indicated cell lines and determined by qRT-PCR following reverse transcription of total RNA. Each value is the mean ± S.D. of three replicates. ND, not detectable. B, SKBR3 and UACC812 cells were treated with vehicle (DMSO), the RARα agonist AM580 (100 nm), the RARβ agonist BMS641 (100 nm), and the RARγ agonist CD437 (100 nm), for 48 h. The panels show bright field images of the cell cultures. The results are representative of two independent experiments.

