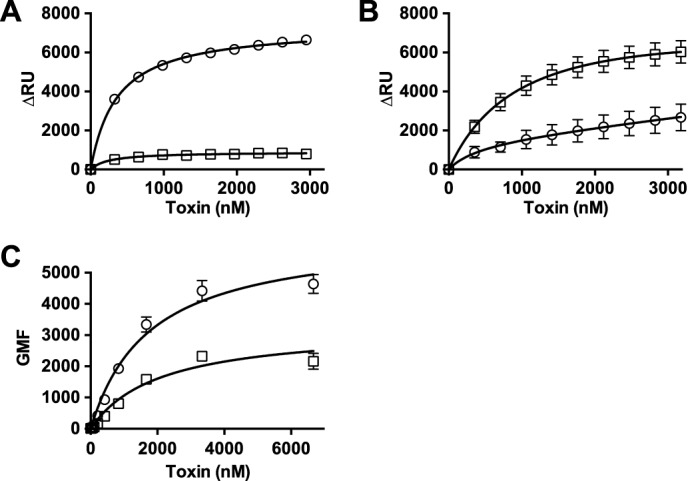
FIGURE 7.

Binding of SLO and SLOS505D to liposomes and C2C12 cells. A, SPR was used to measure binding of SLO (circles) and SLOS505D (squares) to cholesterol-rich liposomes. B, binding of PFO (circles) and PFOD434K (squares) to liposomes (same composition as in panel A). C, binding of SLO (circles) and SLOS505D (squares) to C2C12 cells by flow cytometry (for comparison with PFO and PFOD434K binding to C2C12 cells see Fig. 4A).
