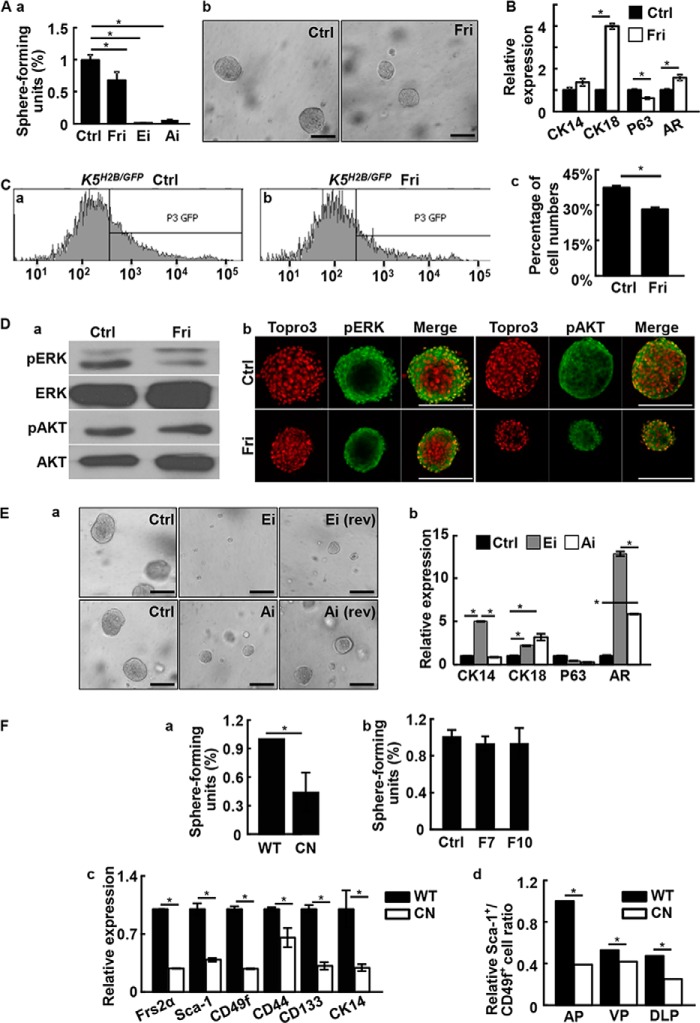
FIGURE 2.
Inhibition of FGF signaling suppresses prostasphere formation. A, prostasphere cultures were carried out with or without the indicated inhibitor for 6 days. Spheres with a diameter greater than 100 μm were scored (a). Representative spheres were shown in b. B, real-time RT-PCR analyses of the indicated genes expression in prostaspheres with or without treating with 500 nm FGFR inhibitors. C, K5H2B/GFP spheres were treated with 500 nm FGFR inhibitors and GFP positive cells were detected by FACS (a and b). The quantitative data are shown in panel c. D, the prostasphere cultures were treated with 500 nm FGFR inhibitor and phosphorylation of ERK and AKT was analyzed with Western blot (a) or immunostaining (b) analyses. E, prostaspheres were cultured with or without 10 μm ERK or AKT inhibitors. Rev indicates that the inhibitors were removed 6 days later. Representative pictures are shown in panel a and real-time RT-PCR analyses of the indicated genes expression are shown in panel b. F, panel a, primary Frs2αcn and Frs2αf/f prostate cells were cultured in Matrigel and the spheres were quantitated at day 10. Panel b, prostate cells prepared from Frs2αcn prostate were cultured in the presence of absence of 10 ng/ml of FGF7 or FGF10. The sphere numbers were scored at day 10. Panel c, total RNA extracted from Frs2αf/f or Frs2αcn prostates were subjected to real-time RT-PCR of the indicated genes. Panel d, FACS analyses showing reduced P-bSCs in individual prostate lobes of Frs2αCN prostates. AP, anterior prostate; VP, ventral prostate; DLP, dorsolateral lobes; Ctrl, solvent control; Fri, FGFR inhibitor; pERK, phosphorylated ERK; pAKT, phosphorylated AKT; AR, androgen receptor; WT, Frs2αf/f; CN, Frs2αCN; data are normalized with β-actin loading control and expressed as mean ± S.D. from triplicate samples; *, p ≤ 0.05; scale bars, 100 μm.

