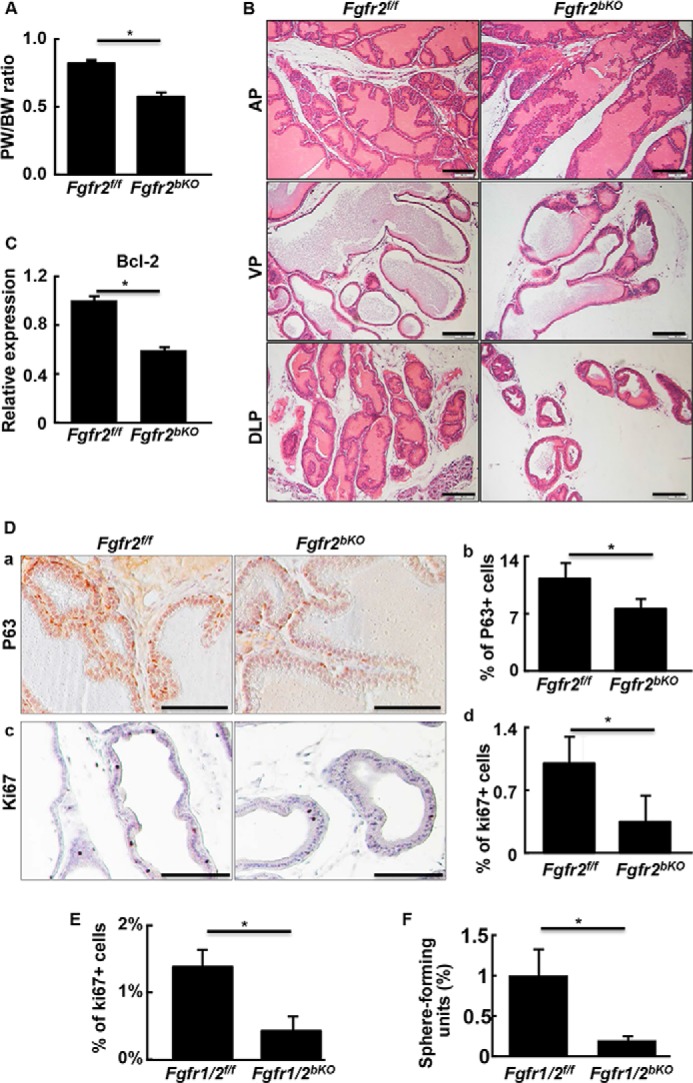
FIGURE 6.

Disruption of Fgfr1 and Fgfr2 in P63 expressing cells perturbs prostate morphogenesis. A, prostate versus body weight ratio showing ablation of Fgfr2 in basal cells compromised prostate growth. B, prostate tissues from 6-week-old mice were dissected, sectioned, and H&E stained. C, real-time RT-PCR analyses showing reduced expression of Bcl-2 in Fgfr2bKO prostate. D, immunostaining showing reduced P63+ basal cells (a) and Ki67+ proliferating cells (c) in Fgfr2bKO prostate. Average cell numbers calculated from three samples are shown in panels b and d, respectively. E, prostate sections of 6-week-old Fgfr1/2bKO mice were immunostained with anti-Ki67 antibodies and the Ki67 positive cells were quantitated. F, sphere-forming efficiency of the indicated primary prostate cells was analyzed. Average numbers of positive cells were calculated from 3 individuals and expressed as mean ± S.D.; *, p ≤ 0.05; scale bars, 100 μm.
