
FIGURE 3.
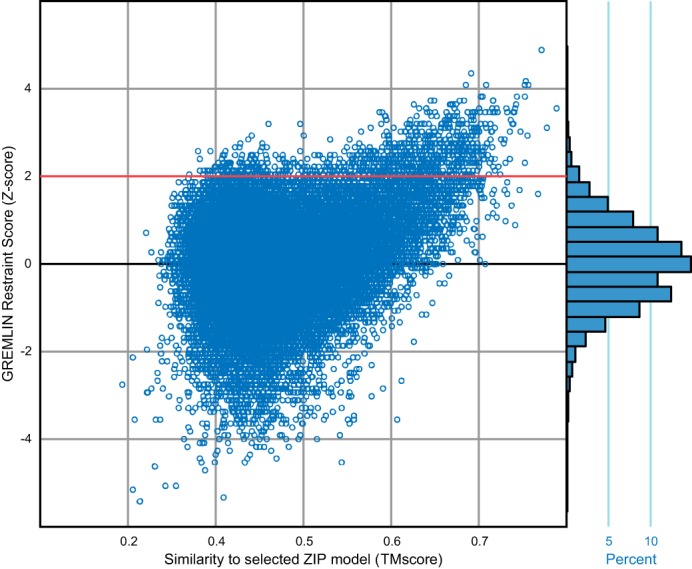
Distribution of GREMLIN restraint scores for Rosetta ab initio models. Models above the red line (with z-score ≥2) were selected for the clustering analysis. The selected model is the refined model from cluster A (Fig. 4A). The ab initio models closer to the selected model tend to have a higher GREMLIN restraint score.