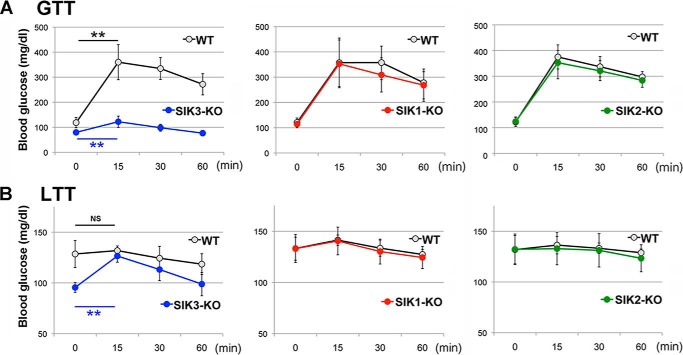
FIGURE 1.
Glucose metabolism in SIK1–3 KO mice. A, WT and SIK1–3 KO mice (8-week-old females n = 6) were starved for 4 h (4 h after lights were on) and subjected to a glucose tolerance test (1.5 g/kg); the blood glucose level was measured. Means and S.D. are indicated. **, p < 0.01 compare with 0 time. B, a lactate tolerance test (1.5 g/kg) was performed under the fed condition (just after the light was turned on).

