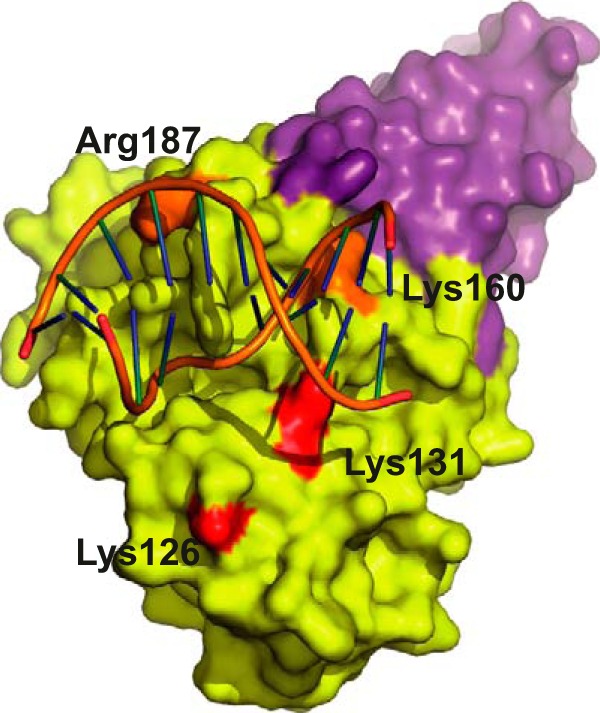
FIGURE 7.

D4 point mutants defective in processivity. The mutated residues (40) are mapped onto the D4 surface (yellow). A201–50 is shown in violet. Mutants shown in orange have ∼35% activity in a DNA replication assay, whereas the ones in red have only ∼10%.
