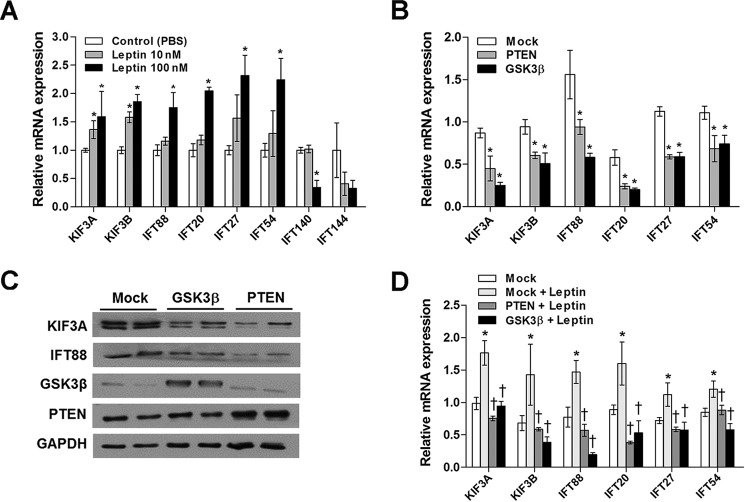
FIGURE 2.
Leptin increases IFT protein expression by inhibiting PTEN and GSK3β. A, real time PCR analysis showing the effects of leptin treatment (2 h) on the mRNA expression levels of IFT proteins in N1 cells (n = 3). *, p < 0.05 versus PBS-treated controls. B and C, a decrease in the mRNA and protein expression of IFT components in N1 cells overexpressing PTEN or Gsk3β (50 ng). *, p < 0.05 versus mock controls. D, effects of leptin treatment (100 nm) on IFT component expression in N1 cells overexpressing PTEN and Gskβ (n = 3). *, p < 0.05 versus leptin-untreated and mock DNA-transfected control. †, p < 0.05 versus the leptin-treated and mock DNA-transfected groups. Data are shown as the means ± S.E. (error bars). Each treatment was performed in triplicate and repeated ≥2 times.

