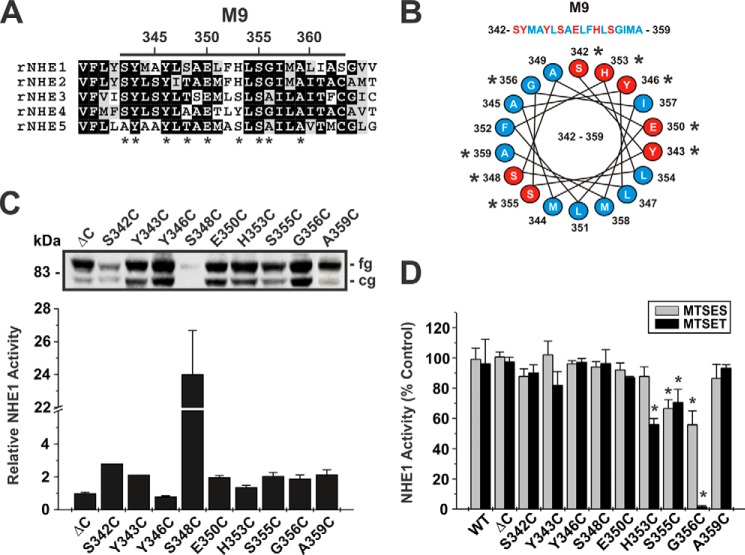
FIGURE 3.
Functional analysis of single cysteine substitutions in membrane-spanning segment M9. A, alignment of M9 sequences from rat (r) NHE1 to NHE5. Amino acids that are highly conserved are shaded in black, whereas moderately conserved are shaded in gray. Asterisks indicate residues that were mutated to cysteine. B, helical wheel representation of M9 with hydrophobic and hydrophilic amino acids depicted by blue and red shading, respectively. C, Western blot analysis displaying the protein expression levels of the cysteine-less NHE1HA (ΔC) and the single cysteine-substituted mutations in M9. The slower migrating band represents the fully glycosylated (fg) form of the protein, whereas the faster migrating band represents the core glycosylated (cg) form of the protein. D, NHE1 activity, defined as rates of amiloride-inhibitable H+-activated 22Na+ influx, for WT, ΔC, and the single cysteine-substituted mutants in the presence of 10 mm MTSES or 1 mm MTSET. Results are expressed as a percentage of the uptake catalyzed by each mutant in the absence of the MTS compounds. Values represent the mean ± S.E. of at least 3 experiments, each performed in quadruplicate. Asterisks indicate statistical significance at the 0.05 level by Student's t test (p < 0.05).

