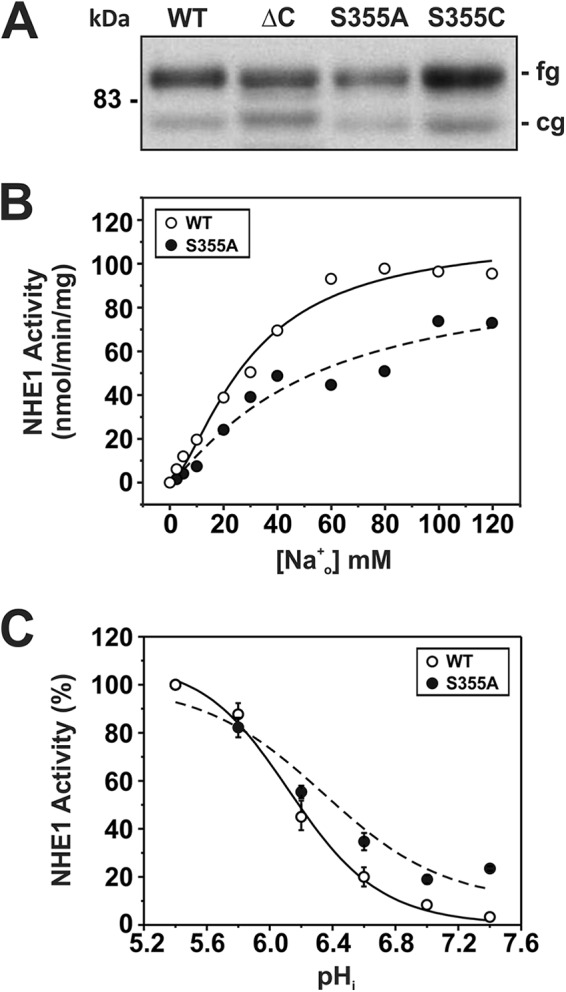
FIGURE 6.

Kinetic analysis of NHE1 mutant S355A. A, NHE1 WT and S355A were stably expressed in AP-1 cells and their relative expression levels were compared with ΔC and S355C by Western blot analysis. NHE1 WT and S355A were assayed for their affinities for Na+ (B) and H+ (C) according to protocols described under ”Experimental Procedures.“ Values represent the mean ± S.E. of 6–9 experiments, each performed in quadruplicate. Error bars smaller than the symbol are absent.
