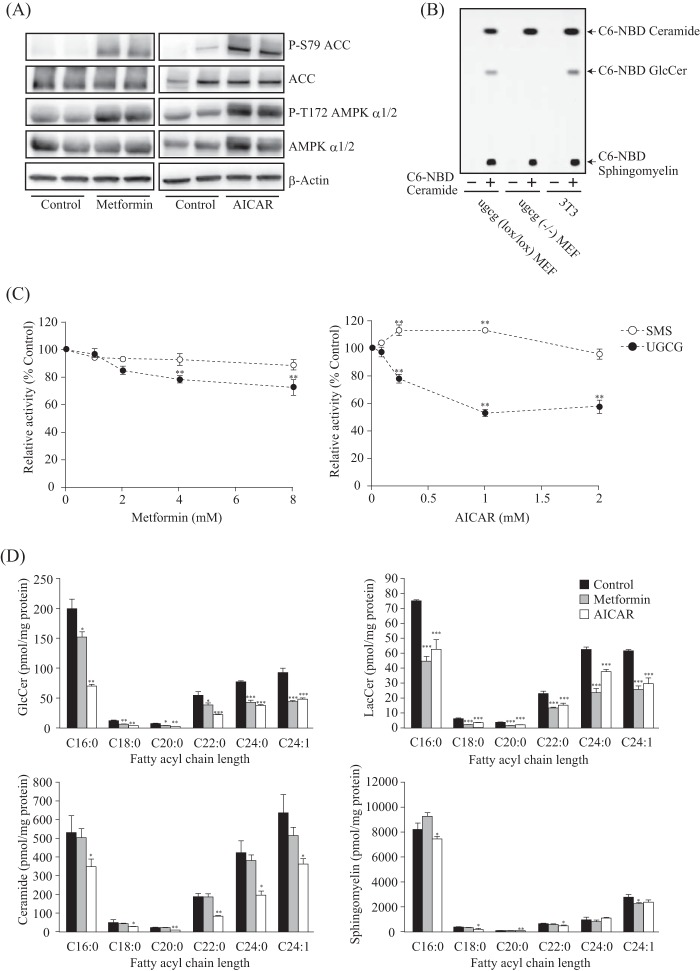
FIGURE 1.
Cellular UGCG activity and sphingolipid levels under AMPK-activating conditions. A, immunoblot analysis showing protein expression and phosphorylation levels of AMPK α subunit and ACC in 3T3 cells. After treatment with or without metformin (8 mm) or AICAR (1 mm) for 8 h, proteins were extracted and subjected to immunoblotting with antibodies against P-S79 ACC, ACC, P-T172 AMPK α1/2, AMPK α1/2, and β-actin. B, TLC analysis showing intracellular UGCG and sphingomyelin synthase activities. Lipids were extracted from ugcg(lox/lox) MEF, ugcg(−/−) MEF, and 3T3 cells that were treated without (−) or with (+) NBD C6-ceramide conjugated to BSA for 1 h, and then they were applied to TLC developed with a solution of chloroform/methanol/water (65:25:4, v/v/v). The reaction products were visualized with an LAS-3000 image analyzer. C, effects of metformin and AICAR on intracellular UGCG and sphingomyelin synthase (SMS) activities. After treatment with several concentrations of metformin and AICAR for 8 h, NBD C6-ceramide conjugated to BSA was added to cells and incubated for 90 min and then analyzed by TLC as described above. D, quantification of cellular GlcCer, LacCer, ceramide, and sphingomyelin levels under AMPK-activating conditions by LC-ESI MS analysis. The bar graphs show the amount of cellular GlcCer (top left), LacCer (top right), ceramide (bottom left), and sphingomyelin (bottom right). Lipids were extracted from cells treated with metformin (8 mm) or AICAR (1 mm) for 16 h, and then they were applied to LC-ESI MS, as described under “Experimental Procedures.” Bars, means ± S.D. (error bars) of at least three experiments. *, p < 0.05; **, p < 0.01; ***, p < 0.001.

