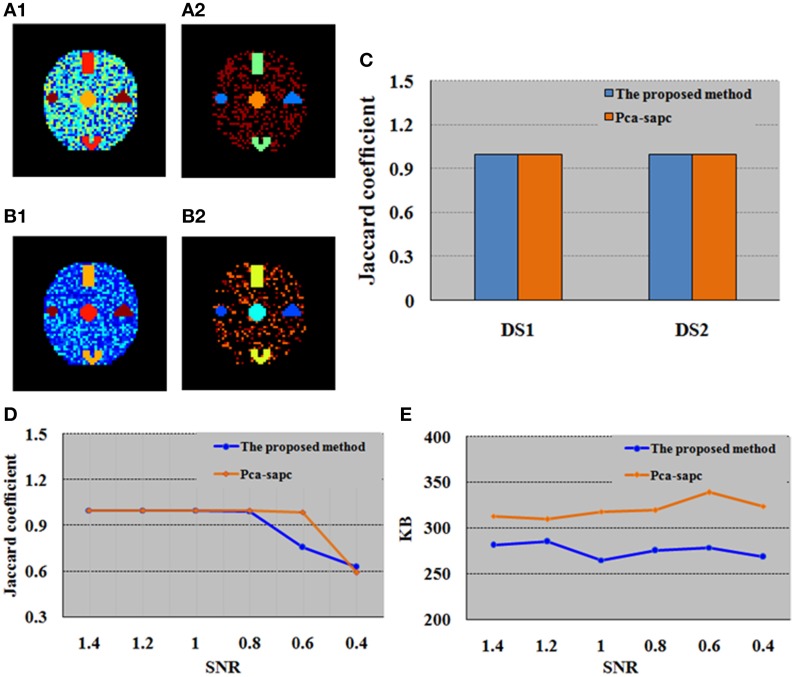
Figure 3.
Comparison between the proposed SOM-SAPC and PCA-SAPC for the simulation tests. (A1) Clustering results (17 clusters) computed by SOM-SAPC for dataset DS1. (A2) Clustering results (12 clusters) computed by SOM-SAPC for dataset DS2. (B1) Clustering results (4 clusters) computed by PCA-SAPC for DS1. (B2) Clustering results (5 clusters) computed by PCA-SAPC for DS2. (C) JCs of DS1 and DS2 calculated by SOM-SAPC and PCA-SAPC, respectively. (D,E) are the findings of DS3 with different SNRs. (D) are results of JCs while (E) describes the maximum memory used by SOM-SAPC and PCA-SAPC, respectively.

