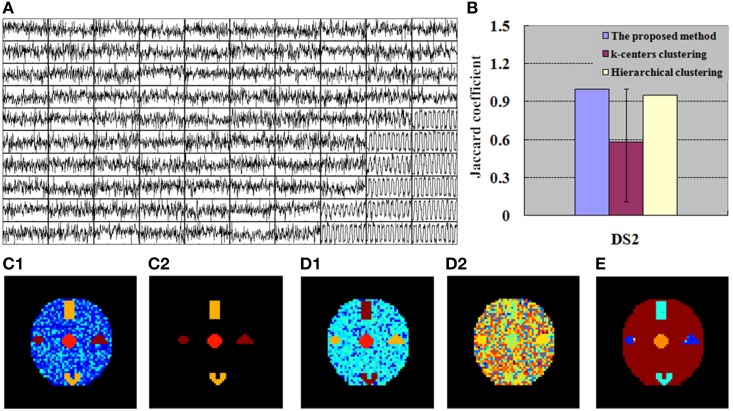
Figure 5.
Finding of DS2 for the simulation tests. (A) 100 exemplar time courses generated by SOM algorithm. (B) JC calculated by the integrated method (SOM-SAPC), k-centers clustering and hierarchical clustering, respectively. The blue value is related to one run of SOM-SAPC, the purple value corresponds to 50 runs of k-centers clustering, and the yellow value is correlated with a single run of hierarchical clustering. (C1) Clustering results (12 clusters) computed by SOM-SAPC, (C2) Reconstructed image with SOM-SAPC when the number of neighborhood voxels in a cluster > 5. (D1) The clustering results generated by k-centers clustering with the maximum JC-values (for 50 repetitions of the methods), and (D2) the minimum JC-values. (E) The clustering result produced by hierarchical clustering.

