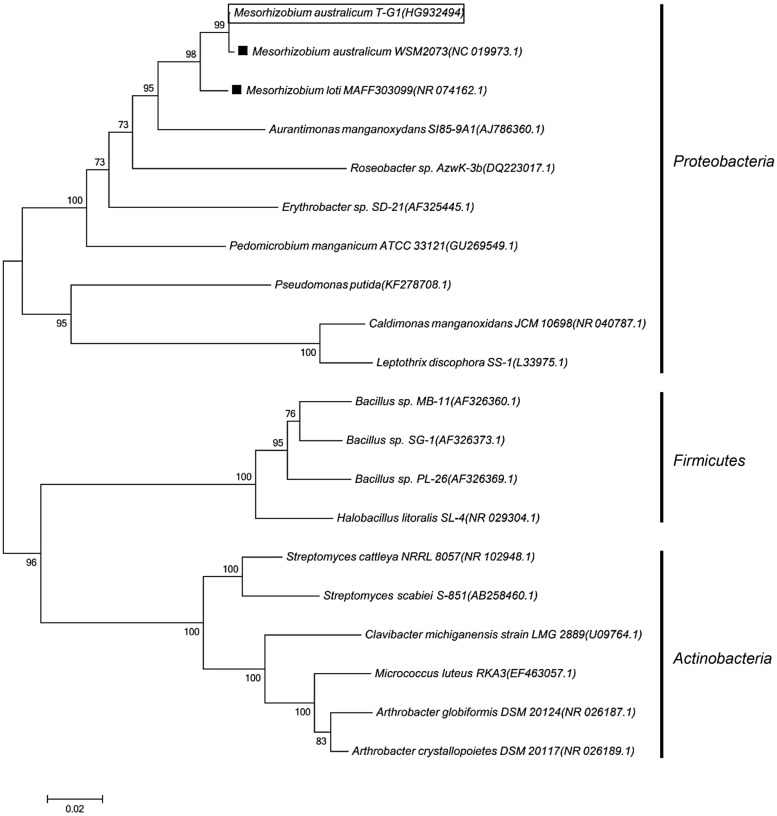
FIGURE 2.
Phylogenetic tree showing the evolutionary placement of Mesorhizobium australicum T-G1 (in rectangle) relative to known MOB based on 16S rRNA gene sequences. black squares indicate non-Mn(II)-oxidizing strains. The tree was built using a neighbor joining algorithm with bootstrap values, displayed as percentages, based on 1000 replicates. Accession numbers for published sequences are shown in parentheses. The scale bar represents 0.02 substitutions per nucleotide position.

