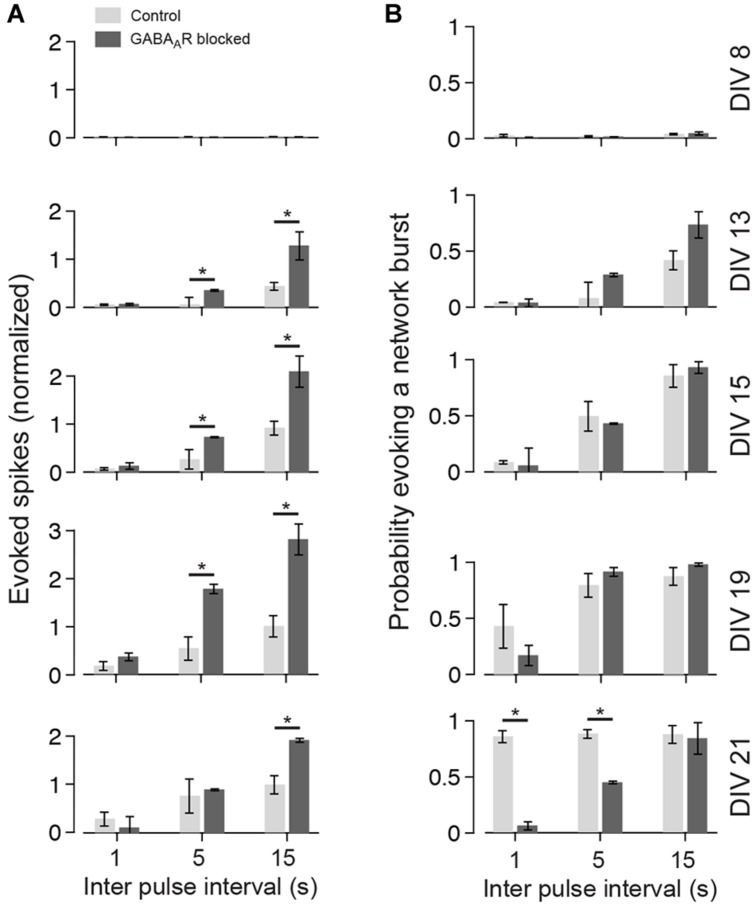
FIGURE 5.
Summary graph for the development of the late responses. (A) The bar plots show the amount of evoked spikes during 21–1000 ms post stimulus in response to various pulse frequencies (light gray controls; dark gray chronically blocked GABAARs) at different DIV (see labeling on the right in B). The graphs are normalized to the maximum of control cultures (DIV 21; Δt = 15000 ms). (B) Same as (A), but for the probability of evoking a network burst (n = 4 each group; asterisks indicate significance; *p < 0.05).

