FIGURE 6.
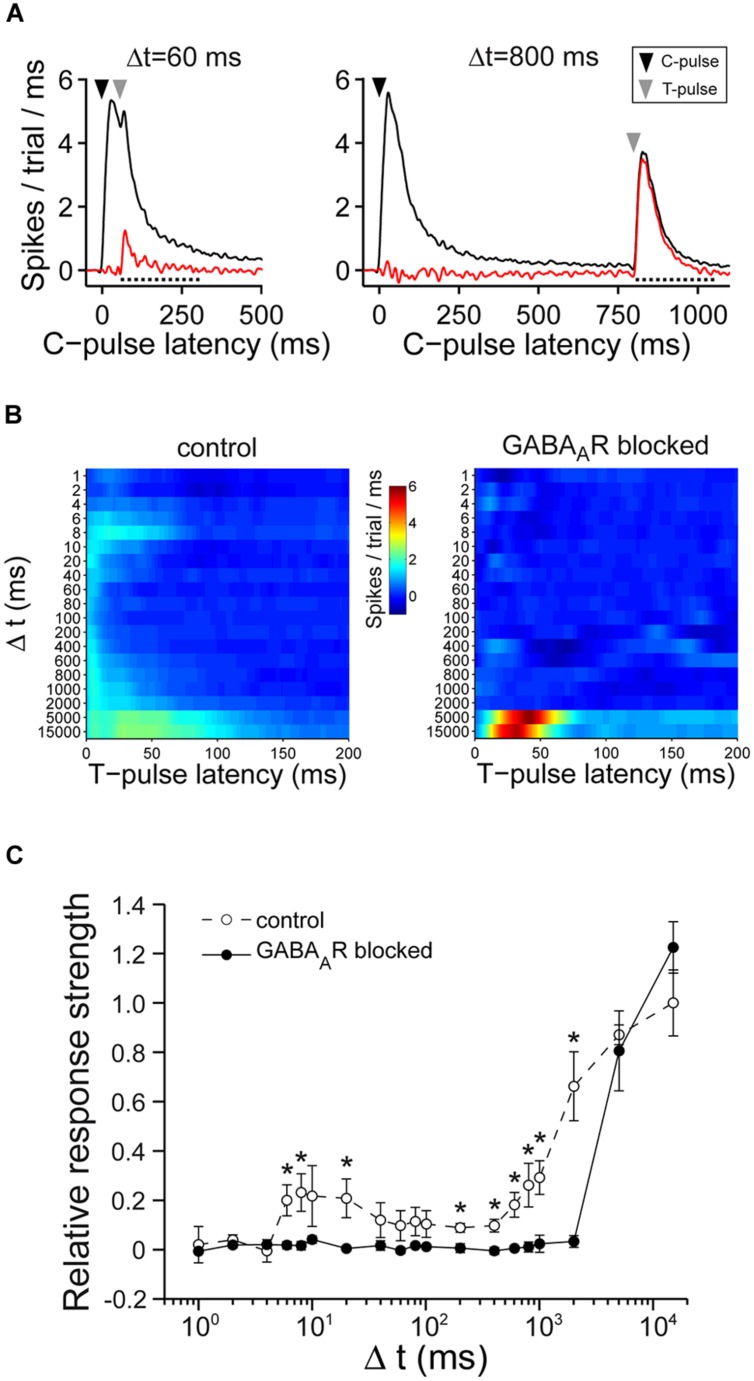
Double-pulse experiments. (A) (Left) Shows an example of the average responses before (black) and after (red) the subtraction of the average response to single pulses for Δt = 60 ms. The dotted line indicates the time window of the first wave of activity post stimulus (200 ms) which was considered for the analysis. (Right) Similar graph to the one on the left except for Δt = 800 ms. (B) The graph shows the spikes post stimulus the T-pulse, after subtraction of spikes that were evoked by single pulses for one culture without (left) and with (right) chronically blocked GABAARs. (C) The summary graph shows the T-pulse responses. The graph is normalized to the average responses of cultures with intact GABAAergic synaptic transmission at Δt = 15000 ms (n = 7 control cultures; n = 6 cultures with chronically blocked GABAAergic synaptic transmission; 21–26 DIV; asterisks indicate significant differences between control and blocked cultures; *p < 0.05).

