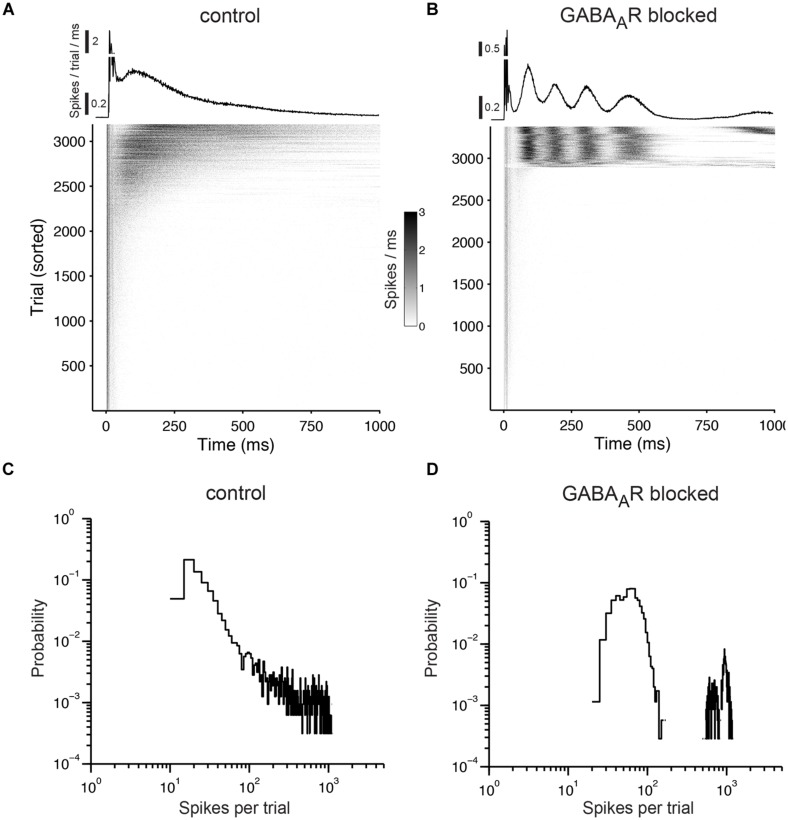
FIGURE 8.
Responses to prolonged electrical stimulation. (A) The top graph shows the trial average of the population responses to electrical stimulation at 1 Hz. The early responses are cut off at 0.5. The gray scale graph below shows the population responses for each stimulation pulse (trials that fall within a network burst were not considered and were omitted). Each gray dot reflects the number of evoked spikes for a 1-ms wide bin. The graph is sorted by the number of evoked spikes. Note that virtually all activity in the network is time-locked to the stimulation pulses. (B) Same as (A) except for a culture with chronically blocked GABAARs. (C) Distribution of the number of evoked spikes during prolonged electrical stimulation. Cultures were stimulated for one hour at 1 Hz under control conditions and (D) with chronically blocked GABAARs. Similar results were obtained in six cultures per group aged between 22 and 36 DIV (see main text for details). The bin width is five spikes.

