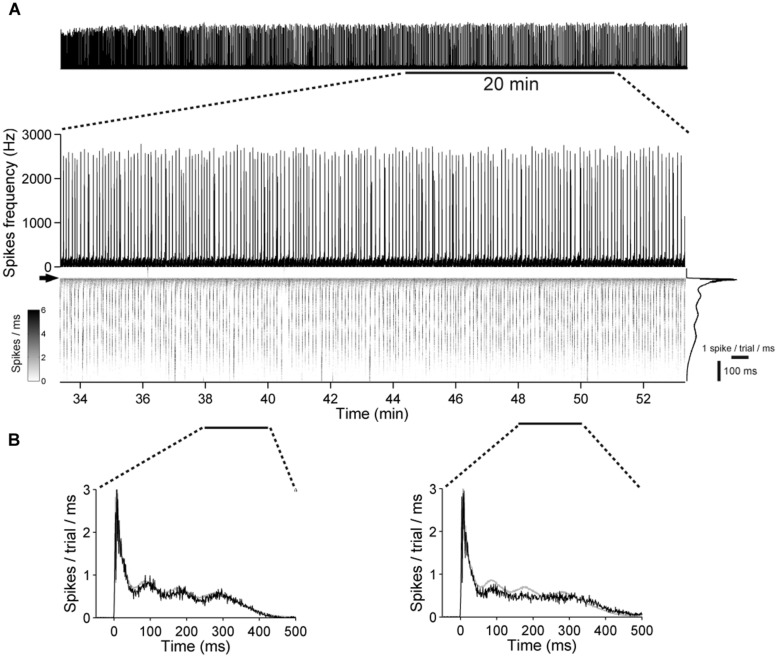
FIGURE 9.
Low variability in the network excitability during prolonged stimulation in networks with chronical absence of GABAAR mediated synaptic transmission. (A) (Top) A 21 DIV old culture during a 1 h stimulation period, at 1 Hz. (Bottom) A 20-min long period is shown enlarged. The gray scale graph shows the evoked responses ranging from 50 ms before up to 500 ms after each stimulation pulse, temporally aligned to the line graph above. The arrow denotes the time point of stimulation. Trial-averaged population response is shown on the right. (B) Trial-averaged population response of the network during 2 min long time intervals (black: response during the indicated interval; gray: all trials).

