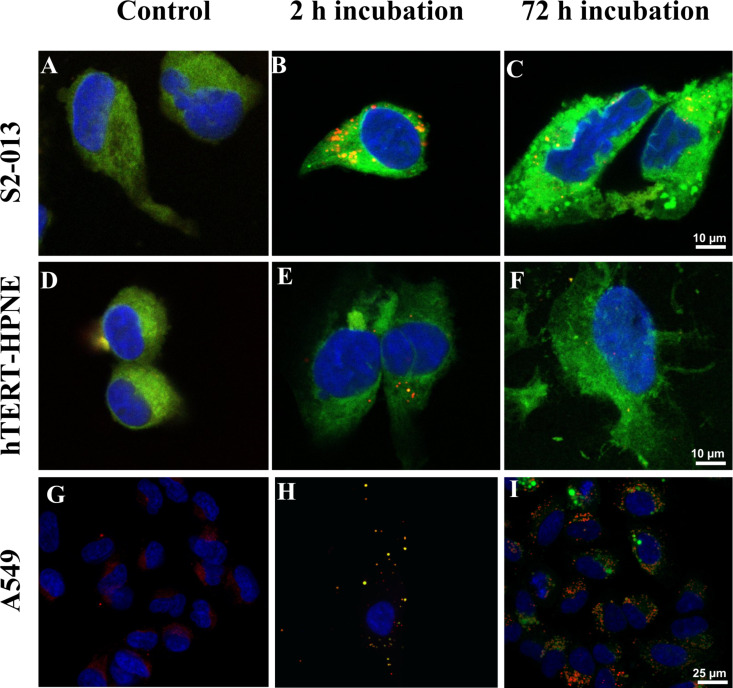
Figure 3.
Confocal laser scanning microscopy images of human cells treated with calcitriol entrapped in C6-PLGA NPs. S2-013 cells: (A) control cells; cells after (B) 2 and (C) 72 h of incubation with C6–calcitriol–PLGA NPs. hTERT-HPNE cells: (D) control cells; cells after (E) 2 and (F) 72 h of incubation with C6–calcitriol–PLGA NPs. A549 cells: (G) control cells; cells after (H) 2 and (I) 72 h of incubation with C6–calcitriol–PLGA NPs. The blue color represents the nuclei and the yellow color represents the colocalization of PLGA NPs with the late endosomes/lysosomes. Scale bar: 10 µm for images A–F, and 25 µm from G–I.

