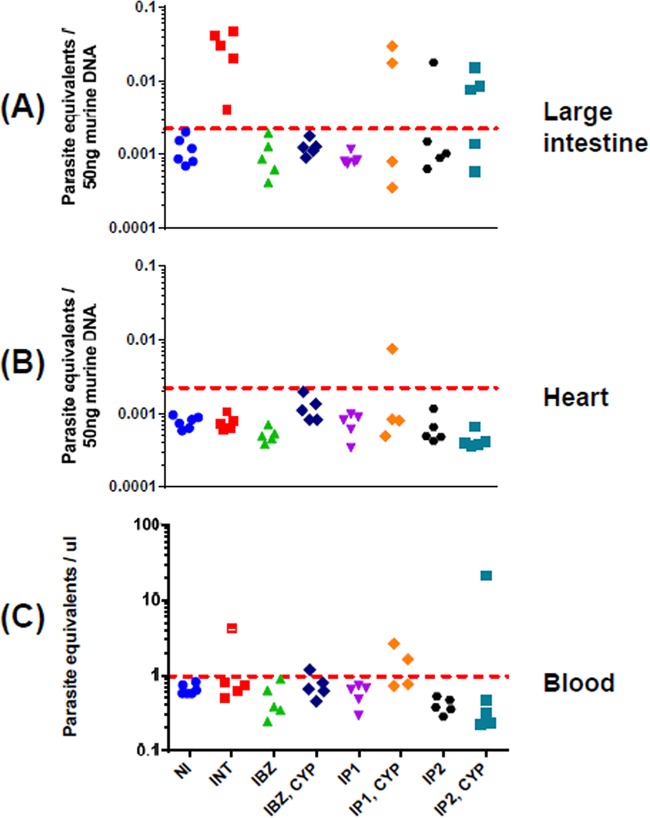
FIG 3.
qPCR-inferred parasite loads in drug-treated chronically infected mice. DNA was extracted from large intestine (A), heart (B), and blood (C) samples, and the relative amounts of T. cruzi and murine DNA were quantified by real-time PCR amplification of the multicopy 195-bp satellite repeat and of the gapdh gene, respectively (Materials and Methods). The limit of detection is represented by the dotted line which corresponds to the mean plus 3 SD of large intestine, heart, or blood samples from uninfected mice. Above this line, there is a linear correlation with the parasite number, as established by a standard curve (see Materials and Methods). In panels A and B, the baseline is equivalent to <1 parasite per 5 million murine cells. In panel C, the baseline established with the multicopy 195-bp repeat corresponds to 1 parasite equivalent per μl of blood. NI, not infected; INT, infected nontreated; IBZ, infected, benznidazole treated (as in Fig. 1); “IBZ, CYP,” infected, benznidazole treated, and then immunosuppressed with cyclophosphamide; IP1, infected, posaconazole (Noxafil) treated; “IP1, CYP,” infected, posaconazole (Noxafil) treated, and then immunosupressed with cyclophosphamide; IP2, infected, posaconazole (HPMC-SV formulation) treated; “IP2, CYP,” infected, posaconazole (HPMC-SV formulation) treated, and then immunosuppressed.

