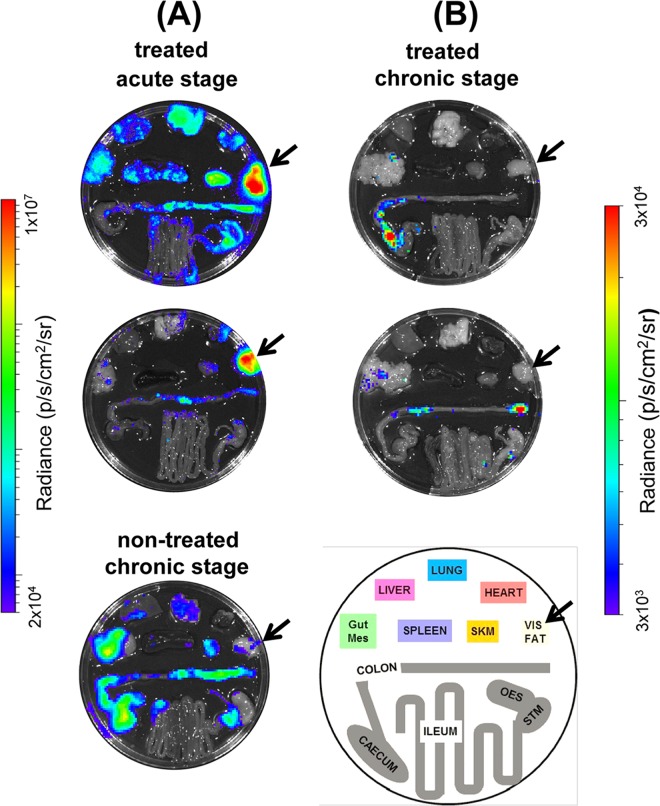
FIG 7.
Ex vivo imaging of cyclophosphamide-induced parasite recrudescence after posaconazole treatment of mice in the acute and chronic stages of infection. (A) Mice in the acute stage of T. cruzi infection were treated with posaconazole for 20 days and then treated with cyclophosphamide (see legend to Fig. 6 for details). Images were taken 74 dpi. For comparison, the lower image shows parasite recrudescence after immunosuppression of a nontreated, chronically infected mouse (imaged at 173 dpi). (B) T. cruzi-infected mice, treated with posaconazole during the chronic stage of infection and then treated with cyclophosphamide (see the legend to Fig. 1). Images taken at 147 (upper) and 148 (lower) dpi. The schematic identifies the positions of organs. Gut Mes, gut mesentery tissue; OES, esophagus; SKM, skeletal muscle; STM, stomach; VIS FAT, visceral fat/adipose tissue. The location of the visceral fat tissue is highlighted by an arrow. Heat maps are on log10 scales and indicate the intensity of bioluminescence from low (blue) to high (red).

