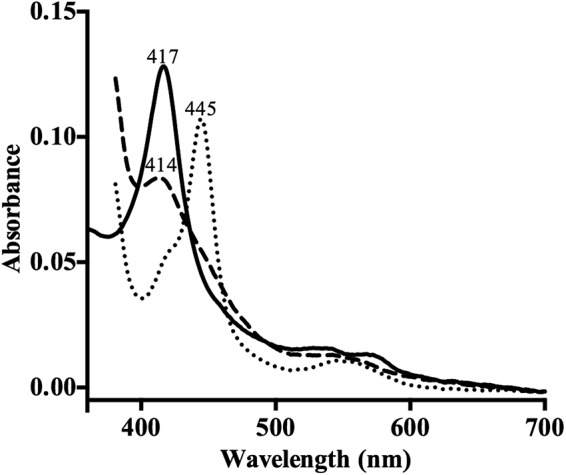
FIG 3.

Spectral characterization of ScErg11p6×His. Data represent the absolute spectra of the ferric protein (solid trace), the ferrous protein reduced with sodium dithionite (dashed trace), and the reduced protein with bound carbon monoxide (dotted trace). Spectra were recorded using 1.5 μM ScErg11p as described in Materials and Methods.
