
FIG 4.
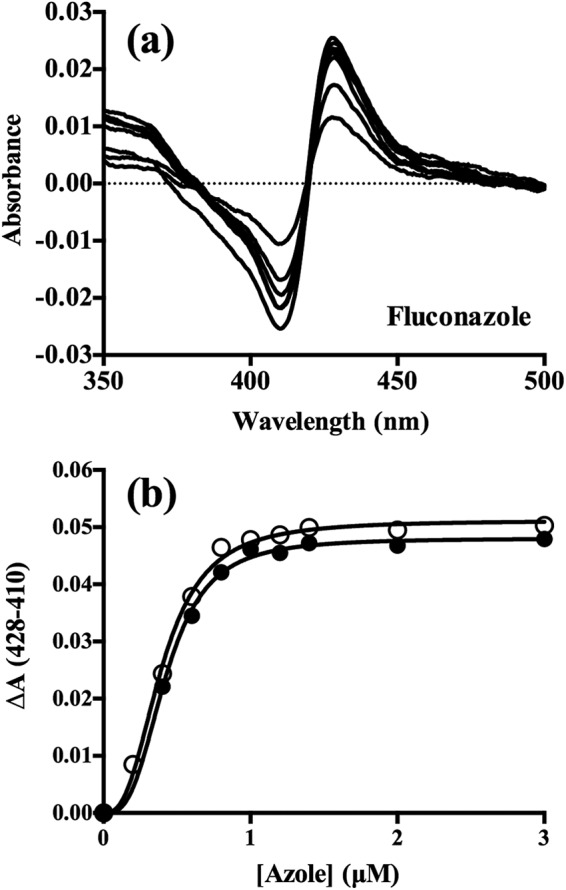
Binding of FLC and VCZ to ScErg11p6×His. (a) Difference spectra demonstrating type II binding of FLC obtained by incremental additions of the drug to 1 μM ScErg11p×His. (b) Saturation curves for FLC (filled circles) and VCZ (hollow circles) fitted to the Hill equation, with ΔA plotted against azole concentration.