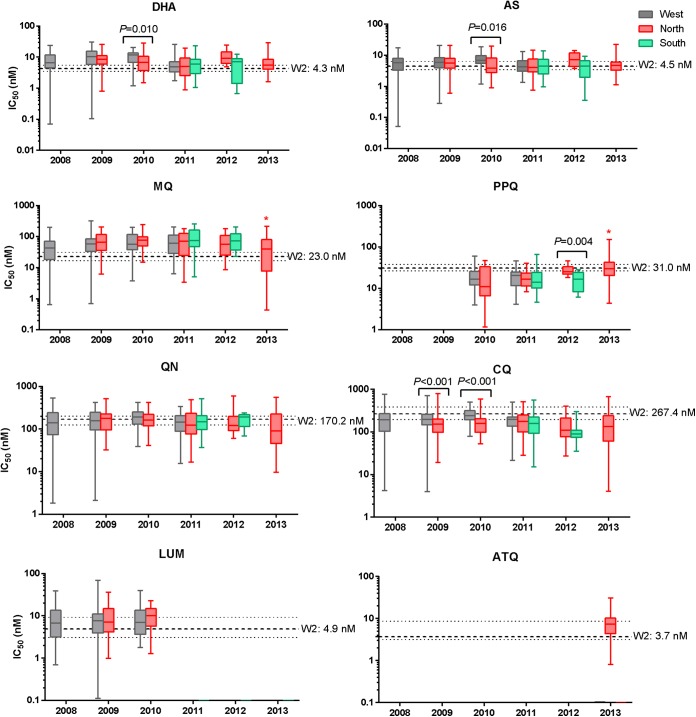
FIG 3.
Ex vivo drug susceptibility of P. falciparum isolates from Cambodia by year and region. Box-whisker plots of IC50s (in nanomolars) are shown for each drug stratified by collection year and region: west (gray), north (pink), and south (green). Dashed lines denote median IC50s against the P. falciparum W2 reference clone and interquartile ranges. Significant P values by Mann-Whitney U test indicate differences in IC50s between regions within the same year. A significant progressive decline in MQ IC50s and rise in PPQ IC50s during 2009 to 2013 in northern isolates is denoted by an asterisk (P < 0.001 by Kruskal-Wallis test).

