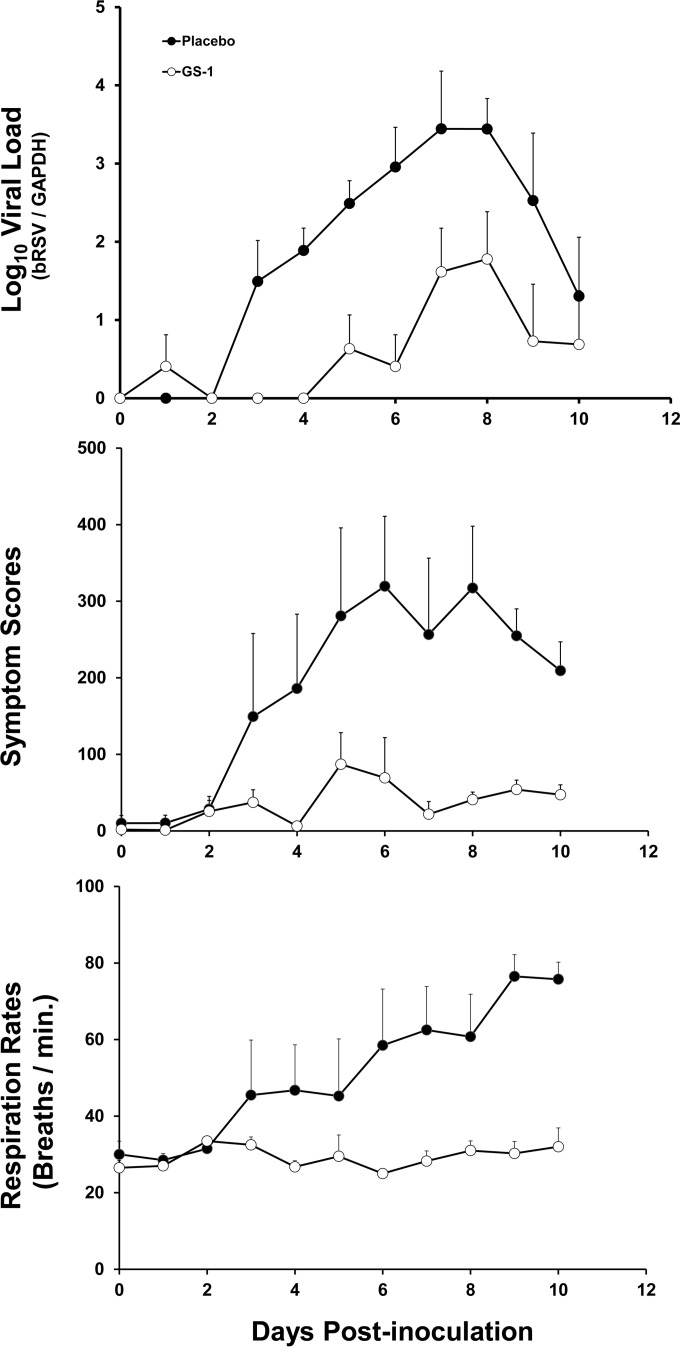
FIG 4.
Mean viral loads, symptom scores, and respiration rates for calves in study 1. Viral loads were quantified from nasal swabs by qRT-PCR, and bRSV RNA values were normalized to GADPH cellular mRNA values. Cumulative symptom scores and respiration rates were calculated based upon daily physical exams for each animal. The mean values of viral load and each score (n = 4 per group) are plotted as a function of time postinoculation, and the positive error bars represent the standard errors of the means.

