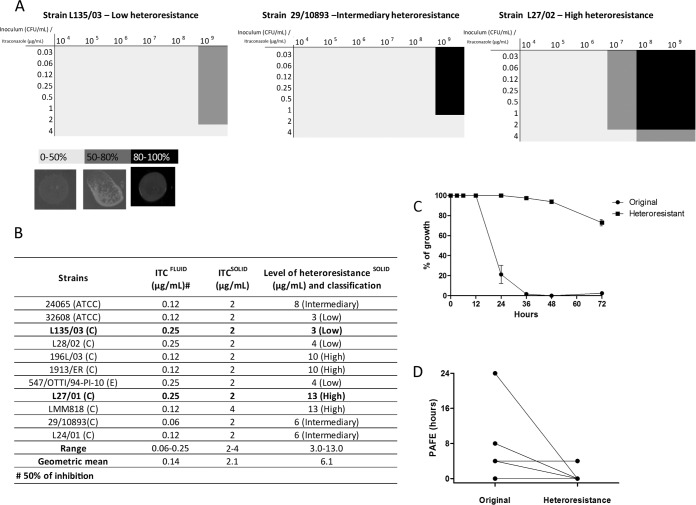
FIG 1.
Screening of original and itraconazole-heteroresistant C. gattii strains. (A) Checker board of the growth of the strains that showed low, medium, and high heteroresistance to increasing concentrations of itraconazole (ITC) on solid medium at 37°C and photos of spot test analyses representing growth of 0 to 50%, 50 to 80%, and 80 to 100% of a random C. gattii strain on SDA medium supplement with itraconazole. (B) Table showing the MIC of itraconazole against the strains in fluid and solid medium and the level of heteroresistance to itraconazole. (C) Time-kill curves. (D) Postantifungal effect (PAFE) in all of the C. gattii strains in which the downward lines represent the strains that showed a reduction in the PAFE and the horizontal lines represent the strains that maintained the same PAFE following induction of heteroresistance. The results of the time-kill curve are expressed as the percentage of growth compared with growth of the control. Results for the PAFE are expressed in hours. Data represent the means from 3 independent experiments consisting of duplicate assays. C, clinical; E, environmental.

