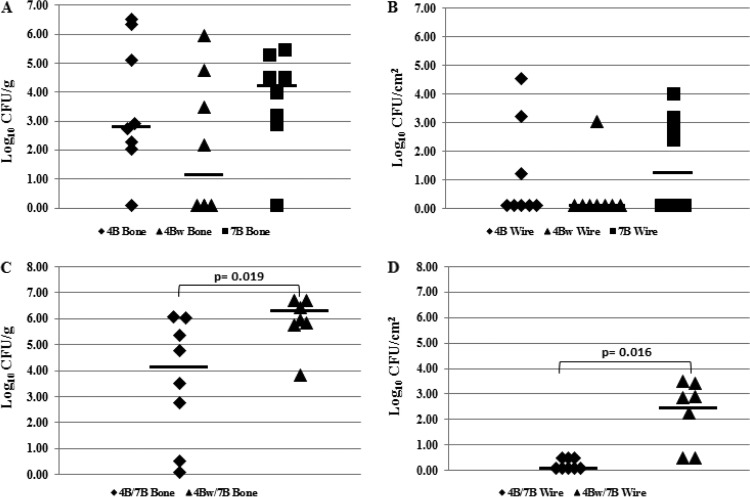
FIG 4.
In vivo fitness results. Bacterial quantities in animals infected with either a single MRSA isolate (A and B) (n = 8) or a 1:1 ratio of rifampin-resistant and -susceptible MRSA isolates (C and D) (n = 8 for 4B/7B, n = 7 for 4Bw/7B) after 4 weeks. (A and C) Results of quantitative cultures of bones. (B and D) Results of quantitative cultures of wires. Log10 CFU/g and CFU/cm2 values reported are from growth on blood agar plates without rifampin. The horizontal bars indicate the median values.

