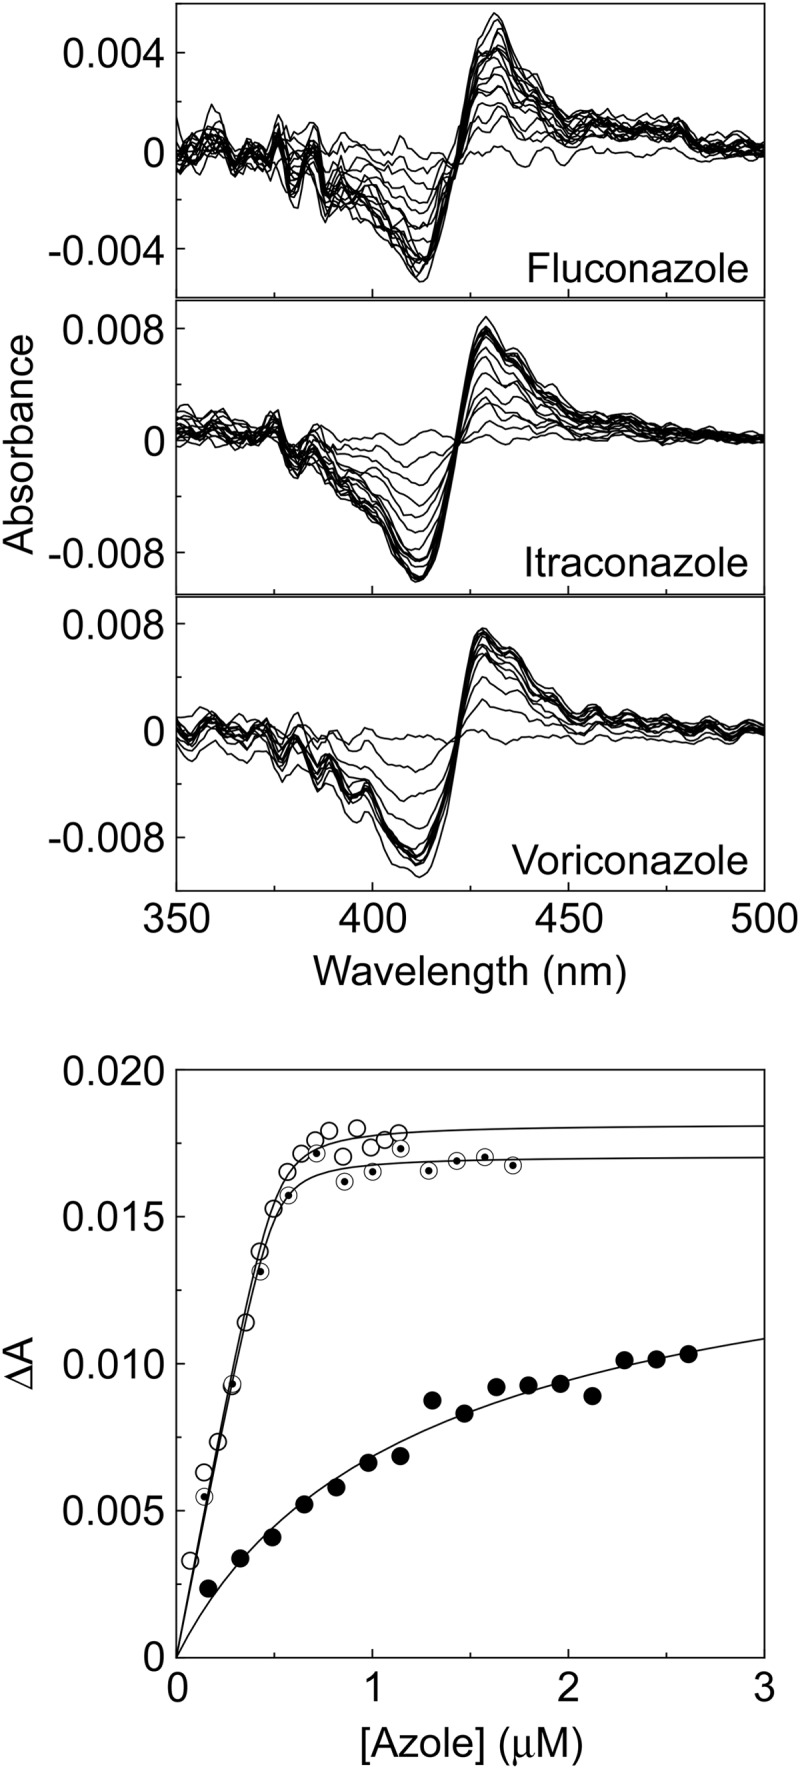
FIG 4.

Azole binding to AcCYP51. Type II difference spectra were obtained by progressive titration of 2 μM AcCYP51 with fluconazole, itraconazole, and voriconazole using 4.5-mm-light-path quartz semi-micro cuvettes. Azole saturation curves for AcCYP51 were constructed from the change in absorbance (ΔA428-412) against fluconazole (filled circles), itraconazole (hollow circles), and voriconazole (bullets) concentrations using a rearrangement of the Morrison equation (29, 30) for the tight ligand binding.
