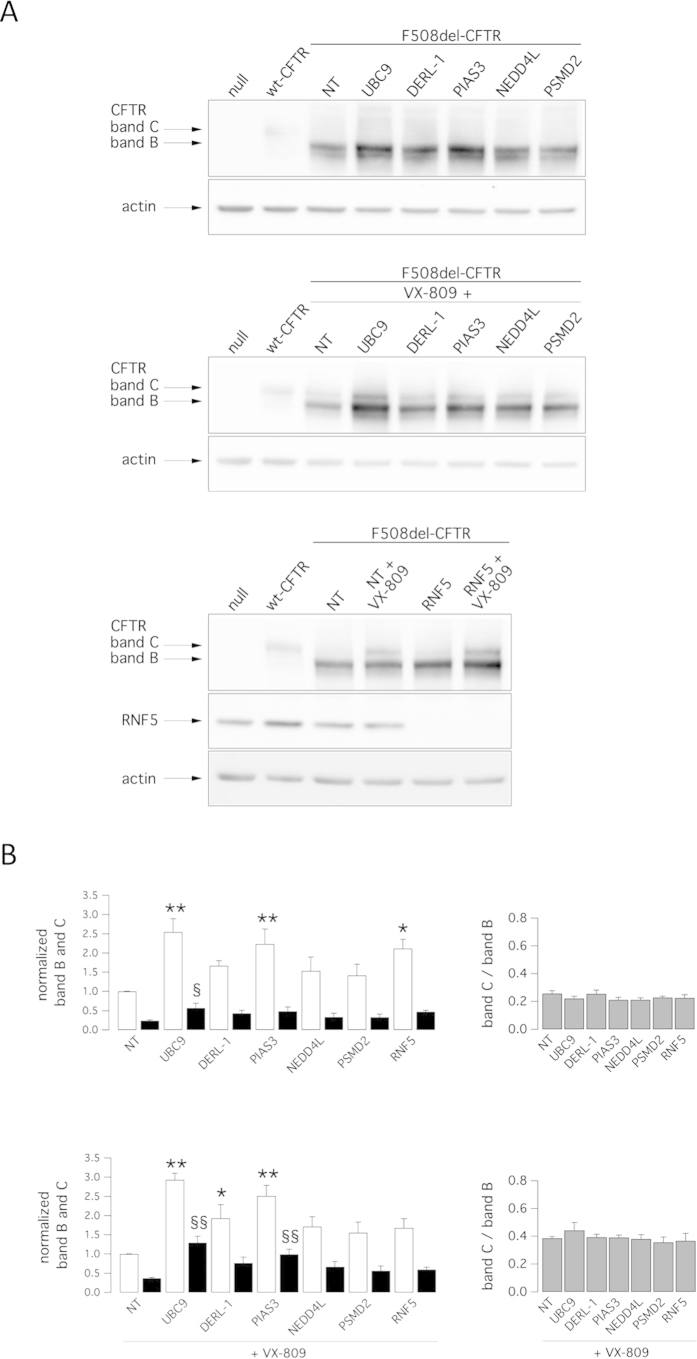
Figure 2. Biochemical analysis of the F508del-CFTR expression pattern.
Shown is electrophoretic mobility of F508del-CFTR in CFBE41o- cells after transfection with indicated siRNAs (30 nM final concentration) in combination with treatment with vehicle alone (DMSO) or VX-809 (1 μM). Cells were reverse-transfected with siRNA and cultured for 24 h at 37 °C and then treated with DMSO or VX-809 for an additional 24 h. A. Immunoblot detection of CFTR. Arrows indicate complex-glycosylated (band C) and core-glycosylated (band B) forms of CFTR protein. B. Quantification of CFTR bands. Left panels: data are expressed as relative abundance of band B (white bars) and band C (black bars), normalized for abundance of band B in cells treated with NT-siRNA + DMSO (top panel) or NT-siRNA + VX-809 (bottom panel). Data are expressed as means ± SEM, n = 3–5 independent experiments. Statistical significance was tested by parametric ANOVA followed by the Dunnet multiple comparisons test (all groups against the control group). Symbols indicate statistical significance versus NT-siRNA band B: **P < 0.01, *P < 0.05; or versus NT-siRNA band C: §§P < 0.01, §P < 0.05. Right panels: graphs reporting the C/B band ratio for data shown in left panels.

