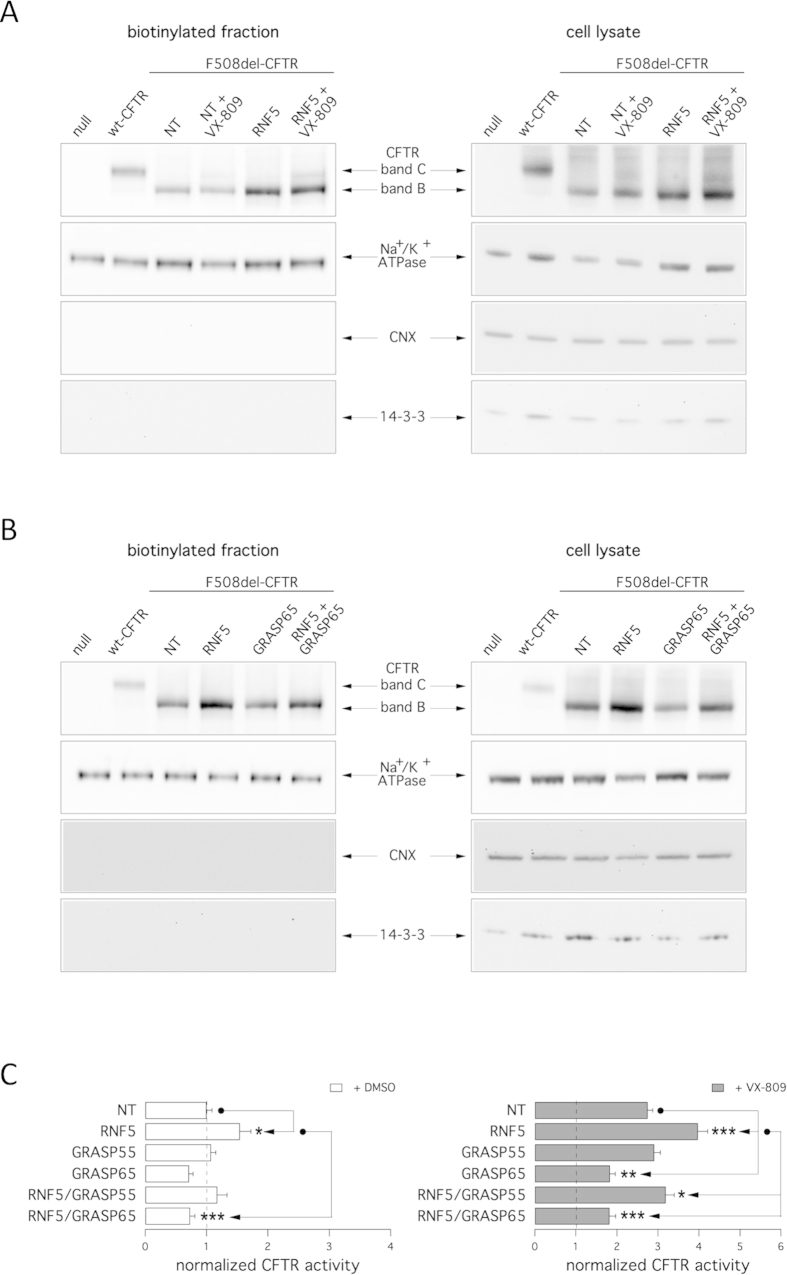
Figure 3. Cell surface expression of complex- and core-glycosylated CFTR.
Detection by cell surface biotinylation of F508del-CFTR forms expressed at the plasma membrane. CFBE41o- cells were transfected with indicated siRNAs (30 nM final concentration) and treated with and without VX-809 (1 μM). A,B. Immunoblot detection of CFTR and control proteins in the biotinylated fraction (left) and in total lysates (right). Arrows indicate the complex-glycosylated form (band C) and core-glycosylated form (band B). Absence of the cytosolic proteins calnexin (CNX) and 14-3-3 in the biotinylated fraction confirms surface protein-specific labeling in each experiment. C. The bar graphs show F508del-CFTR activity in CFBE41o- cells (based on a YFP assay) after transfection with indicated siRNAs (10 nM final concentration) combined with treatment with vehicle alone (DMSO; left graph) or VX-809 (1 μM; right graph). The activity measured upon treatments was normalized for the activity detected under control condition (NT-siRNA + DMSO). Data are expressed as means ± SEM, n = 8 per experiment. Reproducibility of results was confirmed by performing three independent experiments. Statistical significance was verified by ANOVA followed by the Tukey test (for multiple comparisons). Symbols indicate statistical significance versus the respective control.

