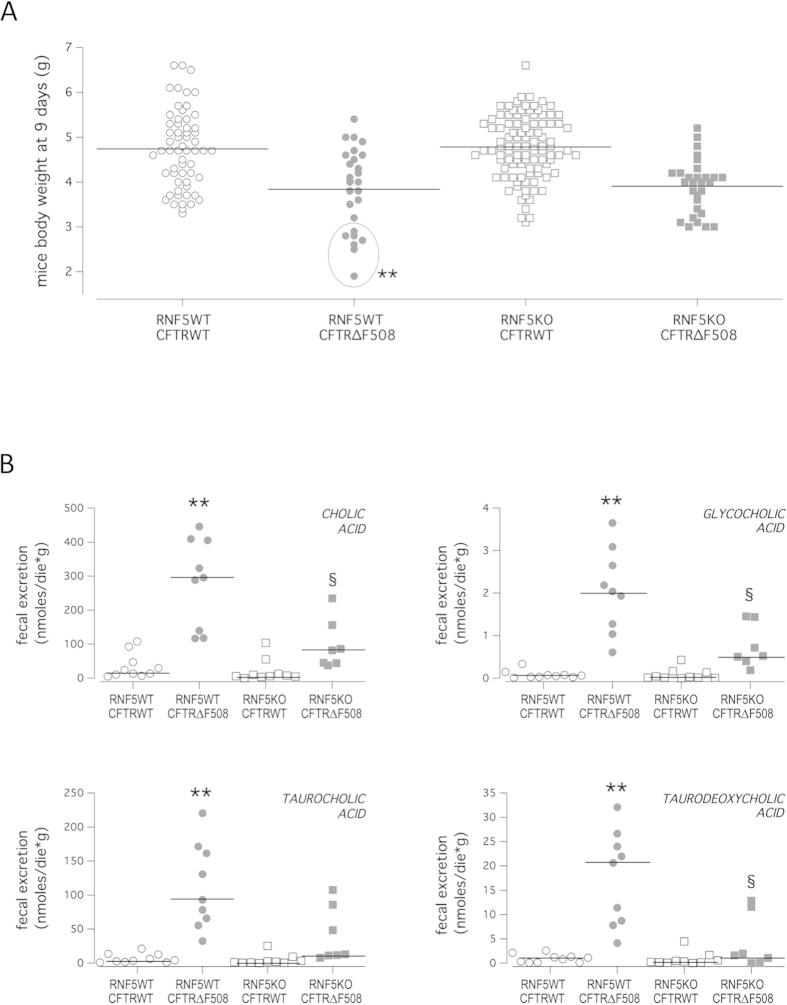
Figure 4. In vivo effect of RNF5 suppression in a CF mouse model.
A. Mouse body weight. Graph shows body weight of 9-day-old littermates (males and females) grouped according to the genotype, as indicated in Methods section. Lines indicate mean values for each group. The quantitative variable “Weight” was dichotomized between mice with RNF5 presence or absence (RNF5WT/CFTR∆F508 and RNF5KO/CFTR∆F508, respectively), and ROC curve anaysis identified a cut-off value of ≤2.9 g (i.e. <3 g). The circle indicates the fraction (26.9% of total) of RNF5WT/CFTR∆F508 mice exhibiting severely reduced body weight (<3 g). Comparison of frequencies of mice with body weight less than 3 grams was performed based on the Fisher’s exact test (as the expected frequencies were less than 5), followed by Bonferroni’s correction. Symbols indicate statistical significance versus the RNF5KO/CFTR∆F508 mice group: **P < 0.01. B. Fecal biliary acid excretion. Graphs show the extent of fecal excretion of indicated biliary acids in mice of different genotypes (as for body weight). Lines indicate median values for each group. Littermates are males and females, 15 to 18 weeks of age on a C57BL/6J genetic background. Comparison of values was performed using the non-parametric Kruskal-Wallis ANOVA test, followed by the Mann-Whitney U test and Bonferroni’s correction. Symbols indicate statistical significance versus the RNF5WT/CFTRWT mice group: **P < 0.01; or versus RNF5WT/CFTR∆F508: §P < 0.05.

