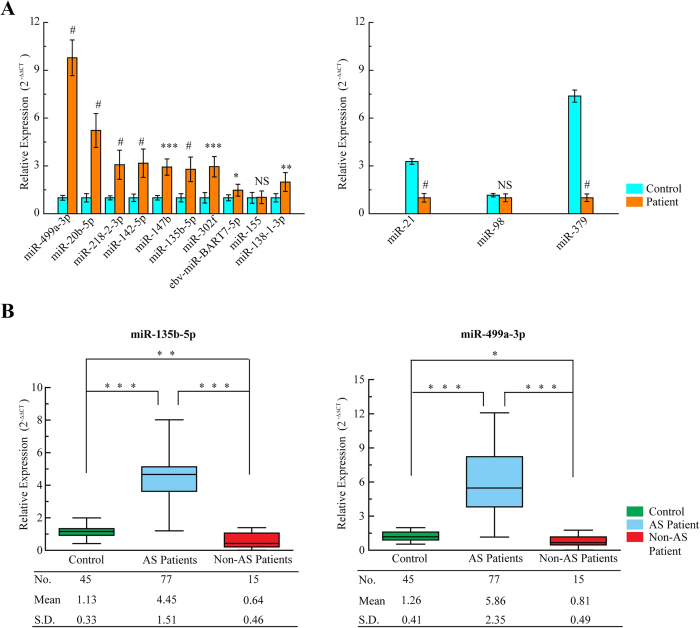
Figure 2. Validation of miRNAs expressions by qRT-PCR.
(A) The microarray cohort included 13 atherosclerotic patients and 5 healthy control subjects. The relative expression of 13 miRNAs was normalized to expression of the internal control (miR-93). The P values were calculated by 2-sided Student t test. *P < 0.05; **P < 0.01; ***P < 0.001; #P < 0.0001. (B) qRT-PCR for miR-135b-5p and miR-499a-3p in an independent validation set of 77 atherosclerotic patients, 15 non-atherogenic cardiovascular patients and 45 healthy control subjects. The P values were calculated by 2-sided Student t test. *P < 0.05; **P < 0.01; ***P < 0.001.

