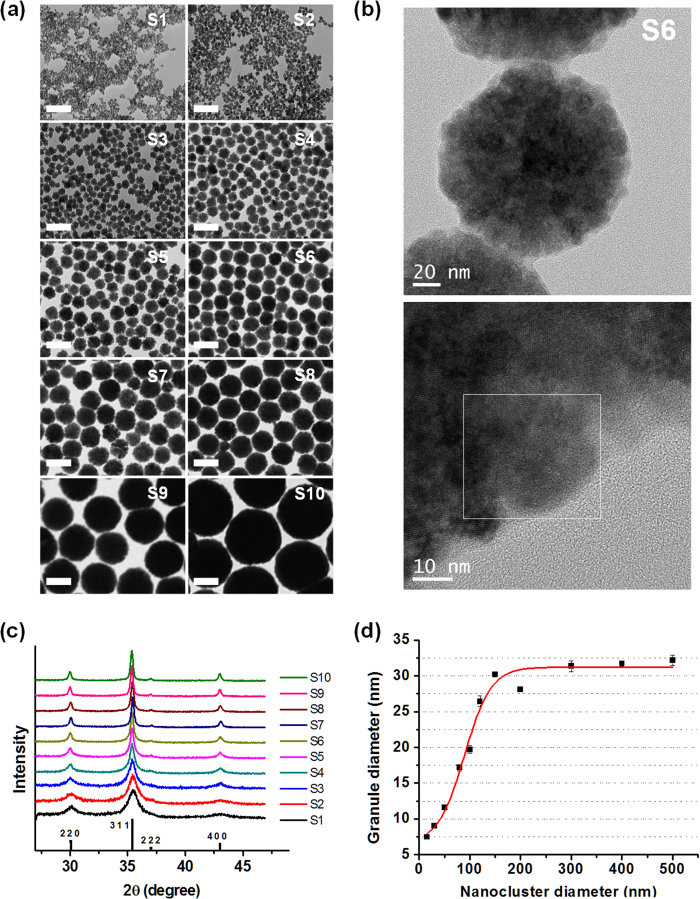
Figure 2. A collection of nanocluster and granule sizes for samples used in this study.
(a) TEM images of magnetite MGNCs with various diameters (scale bars in all images are 200 nm), (b) high-resolution TEM images of sample S6 (top image shows an isolated MGNC, whereas the bottom image shows a corresponding granule marked in a white box), (c) XRD patterns, and (d) average granule diameters calculated from the full-width-at-half-maximum (FWHM) of the strongest (311) XRD peaks.

