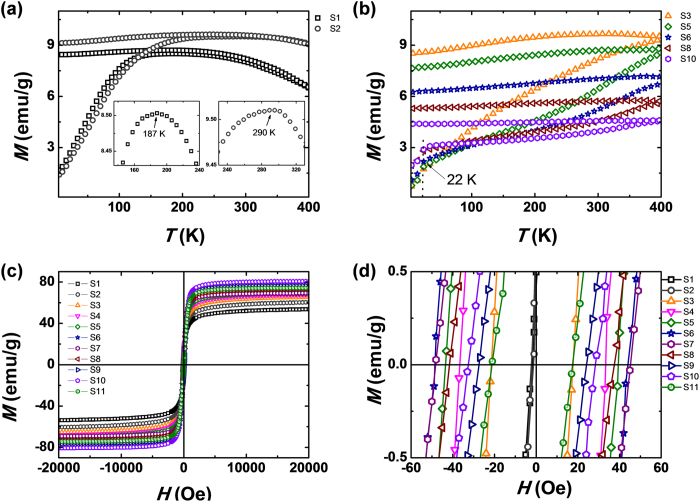
Figure 3. Magnetic property measurements for MGNC samples of various diameters.
(a) and (b) Temperature-dependent magnetization (M–T) curves obtained by ZFC/FC processes measured by PPMS. The top portion of each curve corresponds to the FC process, whereas the bottom of each curve corresponds to the ZFC process. In these subfigures, (a) shows superparamagnetic responses, with a TB of 187 K and 290 K for S1 and S2, respectively, whereas (b) represents ferromagnetic behaviour. (c) Magnetic hysteresis curves of MGNC samples measured by VSM at room temperature. Except for the superparamagnetic samples (S1 and S2), all other ferromagnetic samples show MS above 70 emu/g. (d) Low-field portion showing HC values.

