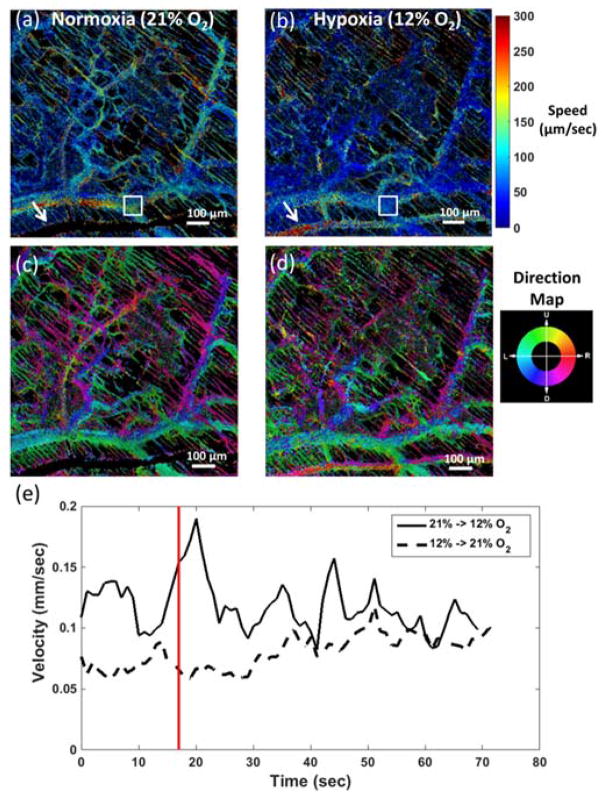
Fig. 5.
Maps of (a, b) speed and (c, d) direction of blood flow in a mouse dorsal window chamber. Flow in the capillaries was detected and appears as the thin, diagonal streaks throughout the image. White arrow indicates an artery with a velocity too high to detect under normoxia but that slows under hypoxia. (e) Plot of average velocity from the region indicated by the white box in (a) and (b) over time as the O2 level is varied. Red line indicates time when oxygen level was altered. Data was computed using the same dataset in Fig. 4 at 580 nm.

