FIGURE 5.

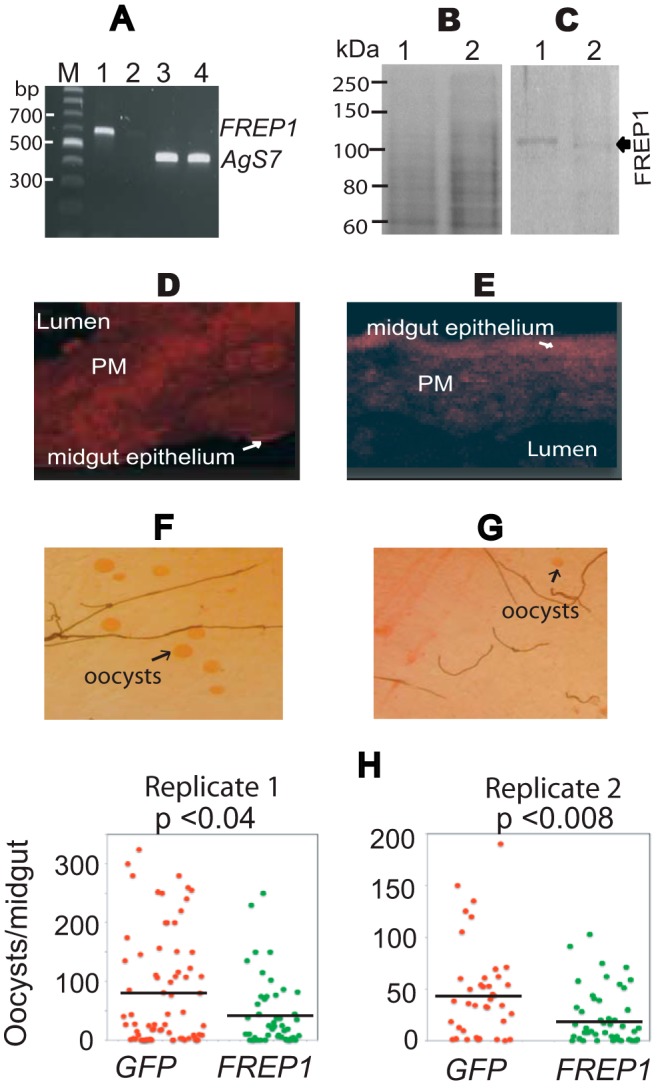
Impact of dsRNA-mediated knockdown of FREP1 on P. falciparum infection in mosquitoes. A, quantitative RT-PCR detection of FREP1 mRNA in dsRNA-treated experimental and control mosquitoes. Lane order: M, DNA ladder; 1, FREP1 expression in GFP dsRNA-treated mosquitoes; 2, FREP1 expression in FREP1 dsRNA-treated mosquitoes; 3, Ags7 expression in GFP dsRNA-treated mosquitoes; 4, Ags7 expression in FREP1 dsRNA-treated mosquitoes. All primer sequences are shown in Table 1. B, GFP dsRNA-treated (lane 1) and FREP1 dsRNA-treated (lane 2) mosquito midgut proteins fractionated on 10% SDS-PAGE and stained with the Coomassie Brilliant Blue. Approximately 10 μg of total protein, extracted from 2 to 3 midguts, was loaded per lane. C, gels were loaded as in B, and proteins were transferred to membranes and probed with 0.2 μg/ml of anti-FREP1 antibody. GFP dsRNA-treated (control, lane 1) and FREP1 dsRNA-treated mosquito (lane 2) midgut proteins are shown. The average pixel intensity values of the FREP1 signal in panel C are 15.93 and 4.24 for the control and experimental group, respectively. D and E, immunohistochemical analysis of midgut tissue sections from GFP dsRNA-treated (D) and FREP1 dsRNA-treated (E) mosquitoes. Sections were probed with anti-FREP1 followed by Alexa Fluor® 594 goat anti-rabbit antibody. The fluoresence intensities of control sections (D) were 17.93 ± 1.77, whereas the fluoresence intensities of FREP1 dsRNA-treated experimental sections (E) were 6.32 ± 0.11. The mean fluoresence intensities and standard deviations were obtained from three sections. F and G, enumeration of oocysts (round red spots) in GFP dsRNA-treated (F) and FREP1 dsRNA-treated (G) mosquito midguts. H, summary data and statistical analyses of the number of oocysts in mosquitoes treated with the dsRNA targeting GFP or FREP1, respectively. y axis represents the number of oocysts per midgut and x axis indicates the treatment groups. The black bars represent the mean oocysts per midgut. The p values between two groups were calculated using Wilcoxon-Mann-Whitney test. Data are representative of two independent experiments.
