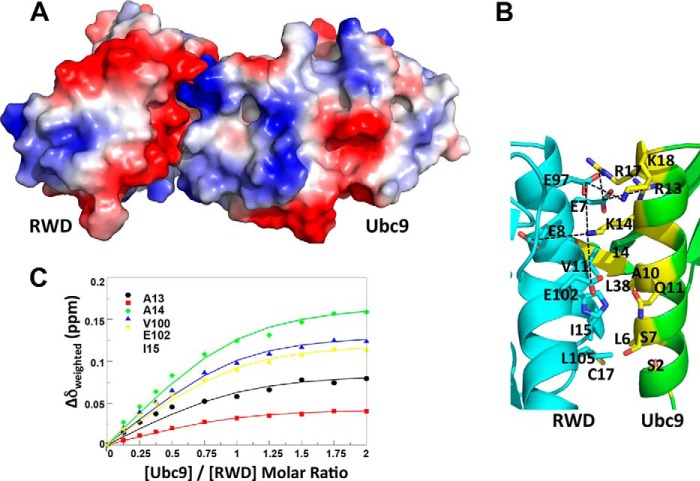
FIGURE 3.
The binding interface and affinity of the RWD-Ubc9 complex. A, surface representation color-coded by electrostatic potential of the RWD-Ubc9 complex. Red to blue corresponds to negative to positive electrostatic potentials. B, zoomed in view of the RWD-Ubc9 binding interface with key interacting residues shown and labeled. C, estimation of Kd of the complex using CSP of cross-peaks of the indicated residues in 15N-labeled RWD as a function of incremental addition of 0.125 molar equivalent of Ubc9. The Kd of the Ubc9-RWD complex was determined by nonlinear least square fitting of CSP as a function of molar ratios of Ubc9 versus RWD.

