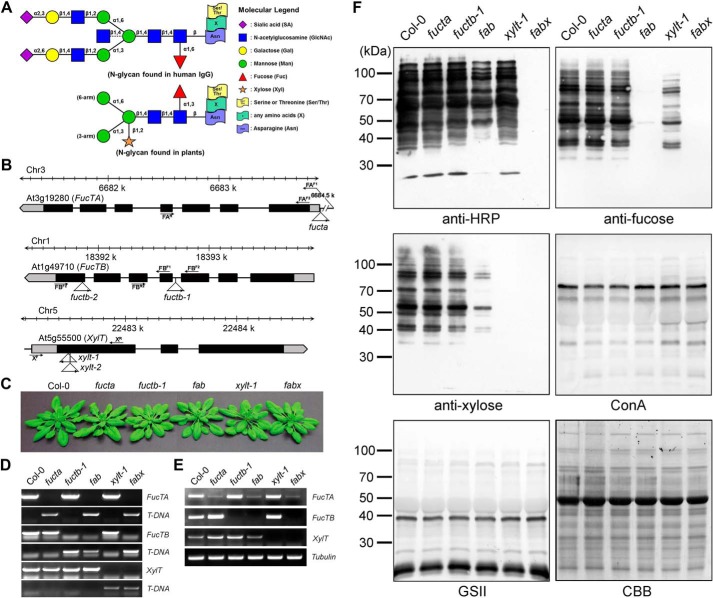
FIGURE 1.
Antibodies show different binding affinities for the proteins extracted from Col-0, fucta, fuctb-1, fab, xylt-1, and fabx. A, schematic representation of the largest N-glycan structure found in human IgG and plants. The largest N-glycan found in human IgG contains a core fucose and is often terminated with a sialic acid. The bisecting arm of the GlcNAc indicated with a dashed line represents around 10% of human IgG glycoforms. PNGXF at the β-linked mannose of the trimannosyl core and proximal GlcNAc residues, respectively, is the predominant N-glycan in plants. B, schematic representation of the T-DNA insertion sites in the FucTA, FucTB, and XylT genes. Boxes represent exons, and black denotes the coding region. T-DNA insertion sites and left border directions are indicated with triangles and arrowheads. PCR primers used in genotyping are indicated by arrows. C, phenotypes of the mutant plants compared with that of Col-0. Plants were grown on soil for 30 days. fucta, fuctb-1, and xylt-1 single mutants were crossed successively to produce fab and fabx. D, PCR-based genotyping of the mutants. Gene-specific primers were designed and used in combination with T-DNA left border primer. E, RT-PCR analysis of the mutants. Levels of transcripts in Col-0 and indicated mutants were determined by RT-PCR with gene-specific primers. Tubulin was used as a control. F, total proteins extracted from 3-week-old seedlings were subjected to immunoblot and lectin blot analyses. The immunoblots were probed with anti-HRP, anti-xylose, and anti-fucose antibodies, and lectin blots were probed with ConA and GSII. Coomassie Brilliant Blue (CBB) staining was used to show equal loading of the proteins.

