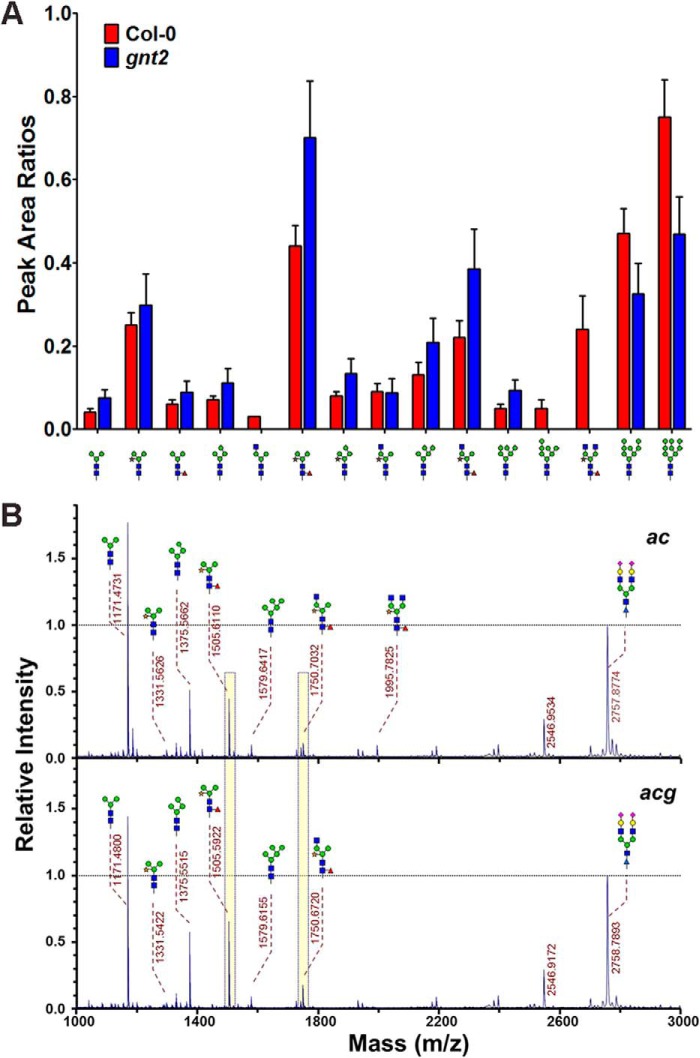
FIGURE 5.
N-Glycans containing β1,2-xylose and α1,3-fucose residues are increased in gnt2. A, relative amounts of N-glycans in Col-0 (red bars) and gnt2 (blue bars). Relative amounts of the N-glycans were compared with the peak area ratios. Error bars indicate S.D. B, MALDI-TOF mass spectra of the permethylated total N-glycans extracted from ac and acg. An isotopically labeled N-linked glycan was used as an internal standard and set to 1.0 for direct comparison of the amounts of N-glycans. Peak areas of the two major complex N-glycans are highlighted with yellow bars for comparison.

