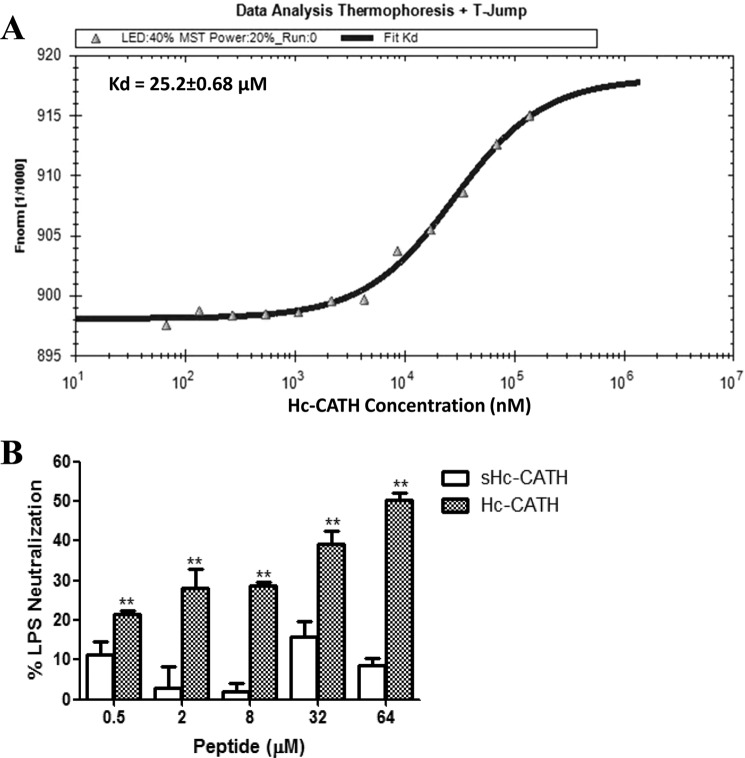
FIGURE 10.
Binding and neutralization of LPS by Hc-CATH. A, Hc-CATH binds to LPS by MST measurement. The x axis represents Hc-CATH concentrations, and the y axis represents the normalized fluorescence. The curve represents a fit of the binding data giving a Kd of 25.2 ± 0.68 μm. B, LPS neutralization by Hc-CATH. A sensitive chromogenic LAL assay was used to evaluate the neutralization of LPS by Hc-CATH. Data shown are mean ± S.E. values from three independent experiments (**, p < 0.01).

