FIGURE 12.
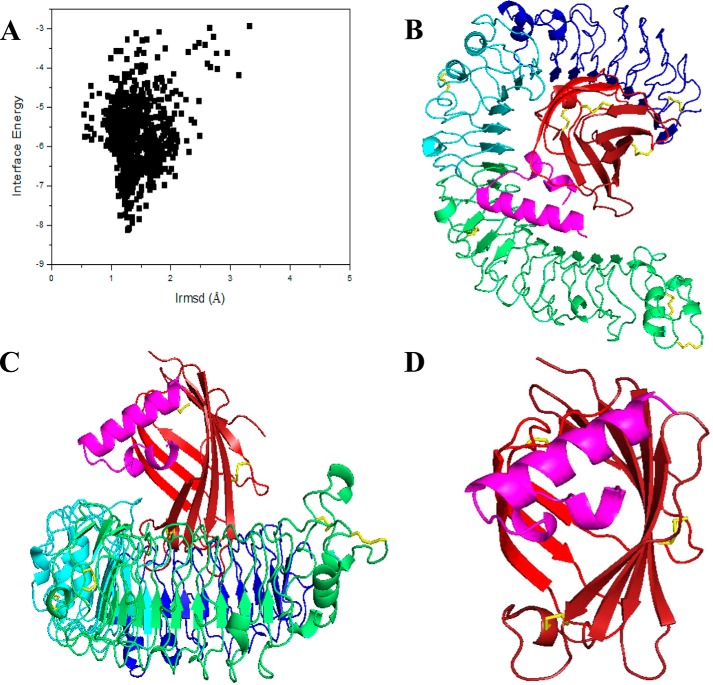
Molecular docking structure of Hc-CATH with TLR4/MD2 complex. A, 1000 decoy structures from a flexible docking study of TLR4/MD2 peptide by RosettaDock. The horizontal axis represents the root mean square deviation value compared with the initial structure during flexible docking, whereas the vertical axis represents the interface binding energy score of RosettaDock. B, overall structure of Hc-CATH binding with the TLR4/MD2 complex from a vertical angle. The N-terminal, central, and C-terminal domains of TLR4 are shown in blue, cyan, and green, respectively. The β-strands of MD2 are shown in red. The disulfide bridges are shown in yellow and Hc-CATH in magenta. C, overall structure of Hc-CATH binding with the TLR4/MD2 complex from a horizontal angle. D, elaborate structure of Hc-CATH binding with MD2.

